Output Data Products
Radial Velocity Timeseries
Radial velocity timeseries data can be downloaded in CSV format using the hiresprv.download.Download.rvcurve() method.
This table contains six columns:
Column name |
Column description |
Units |
Type |
Valid range |
Null value |
|---|---|---|---|---|---|
NAME |
Target name |
string |
14 characters |
UNKNOWN |
|
BJD_TDB |
Barycentric Julian Date in the dynamical time system |
JD |
float |
-inf to +inf |
NaN |
RV |
Radial velocity |
m/s |
float |
-inf to +inf |
NaN |
RV_ERR |
Radial velocity uncertainty |
m/s |
float |
-inf to +inf |
NaN |
BC |
Barycentric correction |
m/s |
float |
-inf to +inf |
NaN |
ADU |
Signal near 5500 Angstroms |
ADU |
float |
0 to +inf |
NaN |
CHI |
Median chi-squared from the doppler fitting |
float |
0 to +inf |
NaN |
Wavelength Solution
Here we provide a standard wavelength solution. Due to the strict requirements on the instrument configuration, this static wavelength solution is good to ±1 pixel for any spectrum observed using the HIRES-PRV configuration.
See below for an example of reading and interpreting this file.
Extracted Spectra
Use the hiresprv.download.spectrum module to access and download the 1D extracted spectra onto your local disk.
The extracted spectra are available as single-extension FITS files. One file is produced for each observation. The FITS file contains an array with dimensions 16 x 4021. Headers for these files are copied directly from the original echellegram images as downloaded from KOA. The value at each location in the array corresponds to the ADU counts summed over the spatial dimension of each spectral trace. These arrays can be loaded along with the wavelength solution files in order to associate them with a rough wavelength calibration.
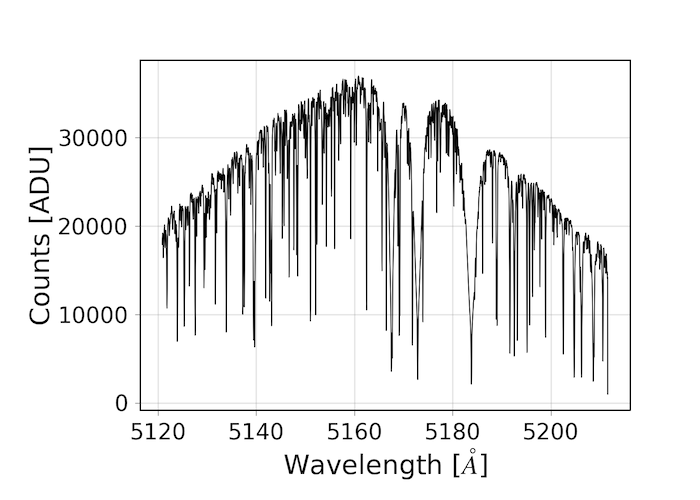
Example Reading Spectrum
Example python code to plot the order containing the Mg B triplet:
In [1]: import hiresprv.download

In [2]: from astropy.io import fits

In [3]: import pylab as pl

In [4]: dl = hiresprv.download.Download('./prvcookie.txt')

In [5]: dl.spectrum('20091231.123')

In [6]: spectrum = fits.getdata(dl.filepath)

In [7]: wavelength = fits.getdata('http://caltech-ipac.github.io/hiresprv/_static/keck_rwav.fits')

In [8]: pl.plot(wavelength[2,:], spectrum[2,:], 'k-')

In [9]: pl.xlabel('Wavelength [$\AA$]')

In [10]: pl.ylabel('Counts [ADU]')

In [11]: pl.show()
Workspace Directory Structure
Below is a sample directory structure for a user workspace and a description of the various types of files contained
in each directory. A listing of all files currently existing in a user’s workspace can be
accessed using the hiresprv.download.directory_listing() method. Any file visible can be downloaded to your local
machine using the hiresprv.download.download() method specifying the full path to the file. The prvState.db
file is the raw SQL database which can also be accessed with the hiresprv.Database methods.
Directory |
Contents |
|---|---|
dnloadlog |
log of actions related to the transfer of raw files into the user workspace |
logsheets |
automatically-generated logsheets summarizing the observations collected on each night |
statuslog |
log of processing status, same information as displayed in the real-time monitor |
idllog |
log of the raw IDL output, useful for diagnosing failures in the IDL code |
fits |
extracted 1D spectra, named by observation id (e.g. r20091231.134.fits) |
deblazed |
extracted 1D spectra, named by observation id (e.g. r20091231.134.fits), blaze function removed |
rv |
RV timeseries files, one file for each target |