Velocity Precision
Consult the plot below when considering exposure times needed to achieve a desired RV precision. This does not factor in any additional sources of instrumental and/or astrophysical noise.
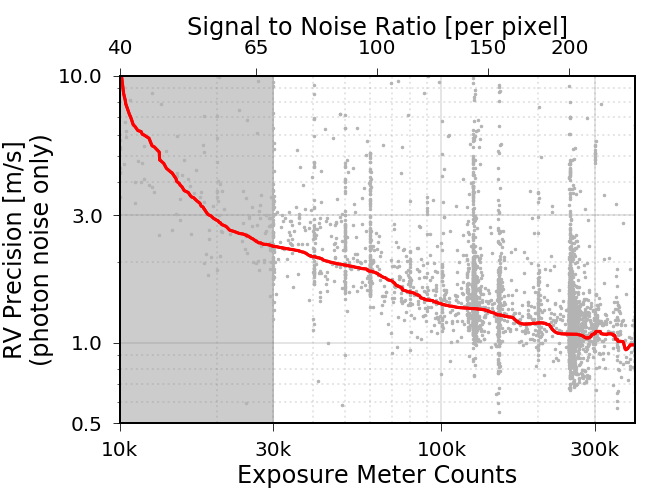
Photon-limited single measurement precision as a function of exposure meter setting and signal to noise ratio. The red line traces the lower 30th percentile of the individual measurements shown in grey. Signal to noise ratios below 70 (indicated with grey shading) are not officially supported by the pipeline and may produce erratic results.
RV Standard Stars
One of the best metrics for assessing the performance of any PRV pipeline/instrument is the RMS of the velocities of standard stars collected over several months or longer. The three stars chosen for the plot below are known to show little to no radial velocity variation on these timescales. The observed scatter in the velocities encompasses most sources of pipeline, instrumental, and astrophysical noise. Velocities produced by the NExScI PRV processing environment show scatter of ~2 m/s for the most well-behaved targets.
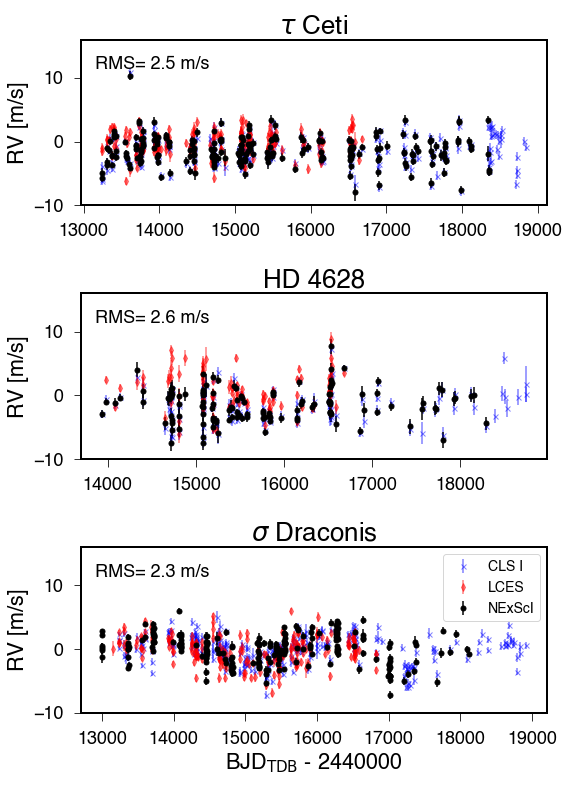
Radial velocity timeseries of several RV standard stars. The names of the stars and the RMS of the velocities are annotated in the figure. Velocities for the same stars from CLS I (Rosenthal et al. 2020) and LCES (Butler et al. 2017) are overplotted in blue and red respectively. The plotted uncertainties do not include instrumental or astrophysical jitter.
Comparison with California Planet Search Pipeline
The PRV processing environment at NExScI is closely related to the California Planet Search (CPS) pipeline so it is useful to compare the RVs produced by both pipelines. Here we perform a series of comparisons with the RVs soon to be published in Rosenthal et al. (2020, submitted) (hereafter, CLS I).
Each star may show a small constant offset relative to the same RV timeseries from CLS I. These offsets are an arbitrary artifact of the pipeline and are subtracted here before performing the comparisons. We use the BJD timestamps to cross match the NExScI RVs with the CLS I RVs and find ~60k overlapping observations. The scatter between the CLS I and NExScI RVs is dominated by a few large outliers with large uncertainties in both datasets. These are low-snr, and/or rapidly-rotating, hot stars for which it is extremely difficult to measure precise RVs. The scatter between the two sets of RVs where the agreement is no worse than 100 m/s is 4.3 m/s. The difference betwen the RVs is caused by small (<0.2 m/s) differences in the barycentric corrections used as initial guesses in the doppler modeling which come from using updated Gaia coordinates for all stars in the NExScI reduction. Those small differences in initial guesses propogate to larger differences in the final RVs. This is especially problematic where the RV is poorly constrained in the final fit and much more dependent on the initial guess. However, when we normalize the residuals by their uncertainties we find that 82% of the RVs are less than 1 sigma descrepant between the NExScI and CLS I reductions.
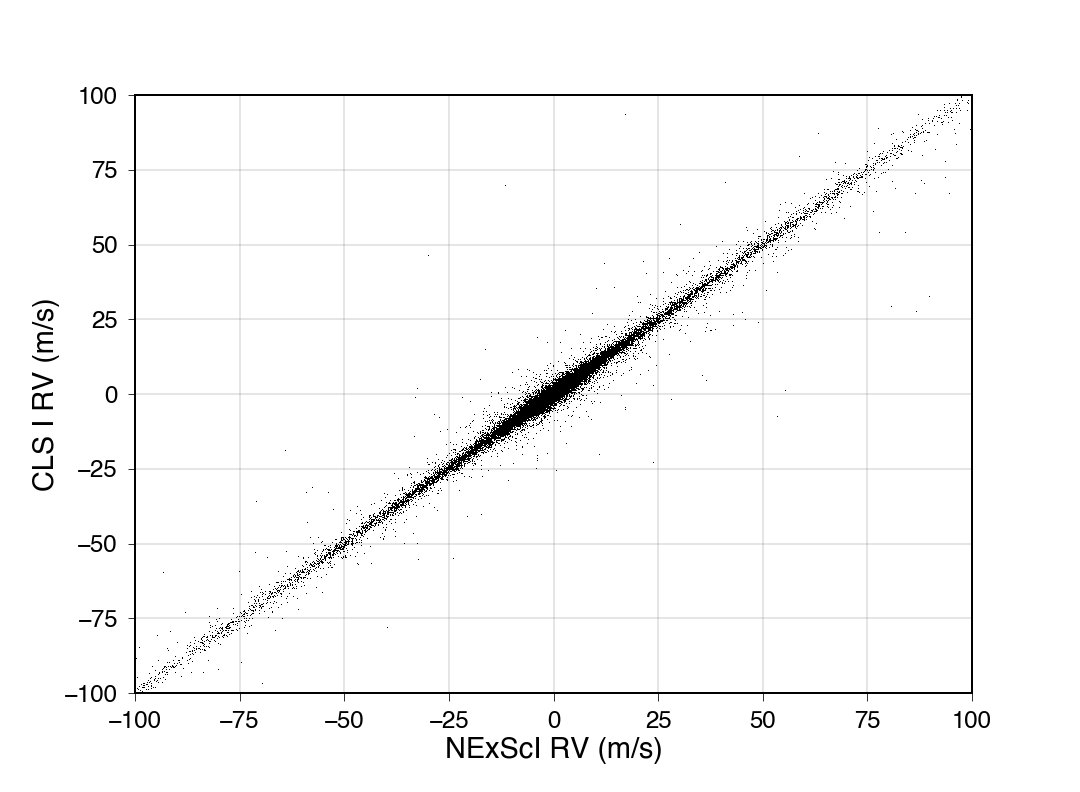
Comparison of the velocities produced by the NExScI PRV processing environment to the RVs published in CLS I produced by the California Planet Search version of the pipeline.
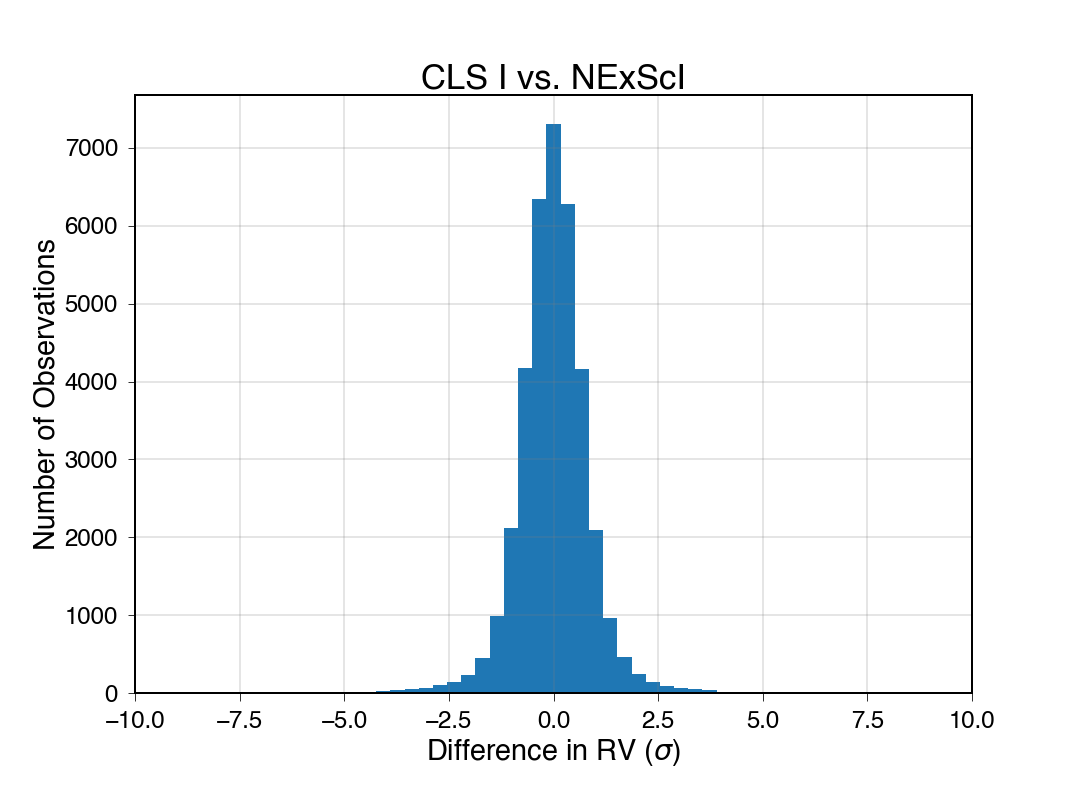
Distribution of RV differences between the NExScI and CLS I reductions normalized by their uncertainties. 82% of the RVs show agreement to better than 1-sigma.
We repeat this comparison to the RVs published in Butler et al. (2018) (LCES hereafter). Although the LCES pipeline was ultimately the prgenetor to both the CPS and NExScI versions of the pipelines they have diverged signficantly. We find a scatter of 5.0 m/s in the difference between the LCES and NExScI RVs after correcting for arbitrary offsets and 50% of the RVs are in agreement to within 1-sigma.
See here for more discussion and comparisons with the lower-level CPS data products. A more detailed comparison with the CLS and LCES data products will be availble in an upcoming publication.
Known Planet Recovery
We demonstrated the ability to detect the PRV signatures of small planets by analyzing one year of archival data collected on the star HD 7924 in addition to the sample nights referenced in the tutorial. This star is known to host three small planets (Howard et al. 2009; Fulton et al. 2015). We use RadVel to fit the data, seeding the fit with the known orbital periods. We can successfully recover the correct velocity semi-amplitude (K) and mass for planets b, c, d, and the long-period signal caused by stellar activity with only a fraction of the data presented in Fulton et al. 2015.
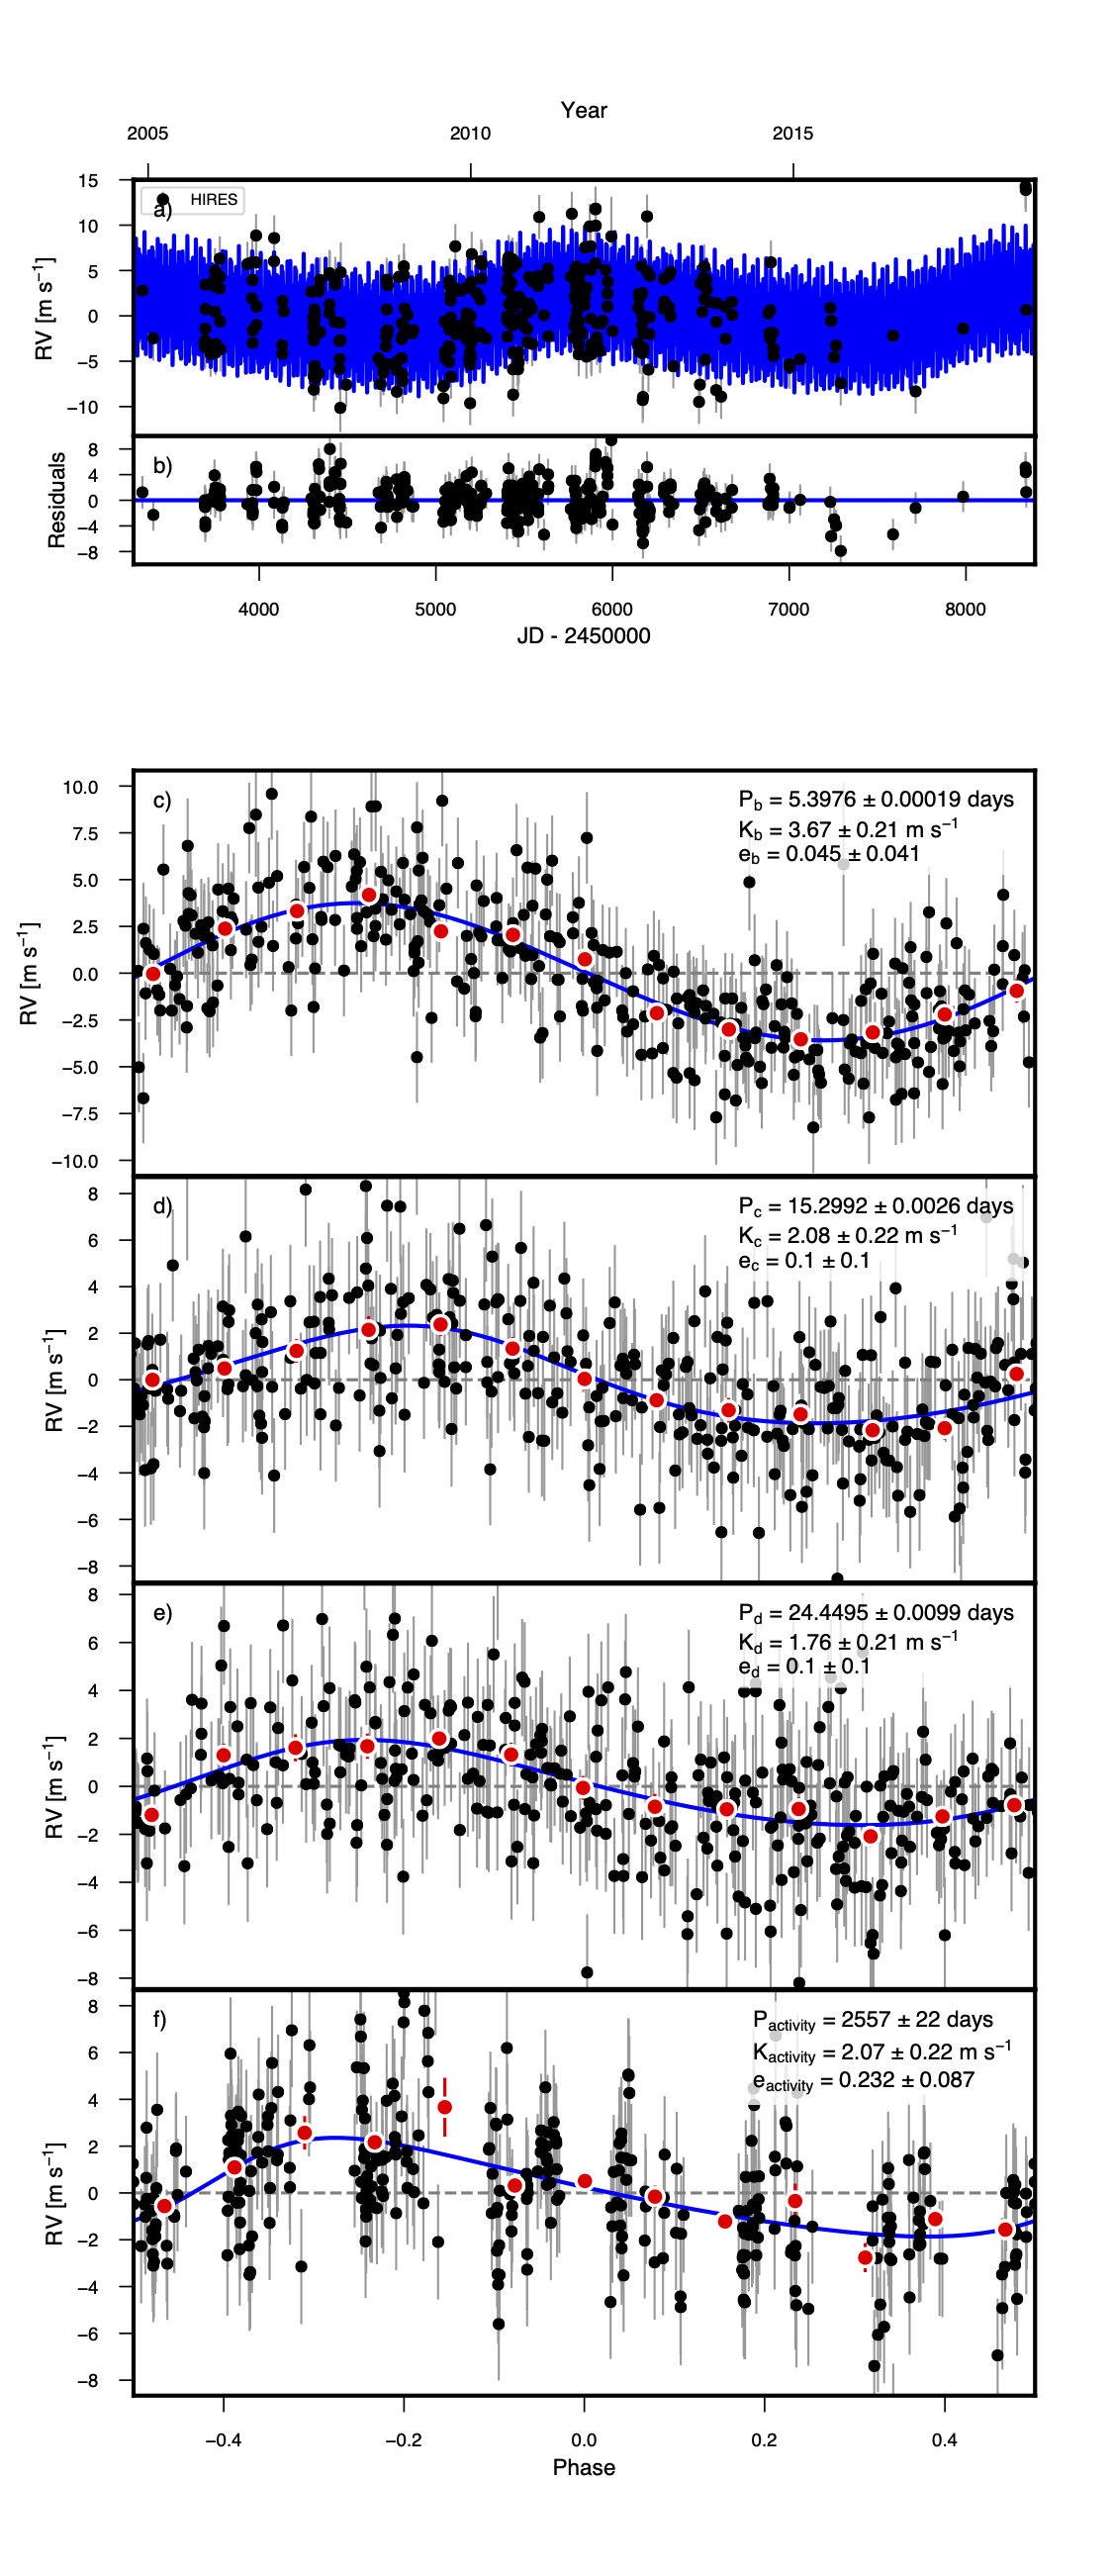
Fit results for HD 7924.