Learning Goals
By the end of this tutorial, you will:
Understand the basic characteristics of Euclid Q1 SIR 1D spectra.
Examine the provided boolean masks
Make a simple plot of a Euclid spectrum.
Introduction
Euclid launched in July 2023 as a European Space Agency (ESA) mission with involvement by NASA. The primary science goals of Euclid are to better understand the composition and evolution of the dark Universe. The Euclid mission is providing space-based imaging and spectroscopy as well as supporting ground-based imaging to achieve these primary goals. These data will be archived by multiple global repositories, including IRSA, where they will support transformational work in many areas of astrophysics.
Euclid Quick Release 1 (Q1) consists of consists of ~30 TB of imaging, spectroscopy, and catalogs covering four non-contiguous fields: Euclid Deep Field North (22.9 sq deg), Euclid Deep Field Fornax (12.1 sq deg), Euclid Deep Field South (28.1 sq deg), and LDN1641.
Among the data products included in the Q1 release are the 1D spectra created by the SIR Processing Function. This notebook provides an introduction to these SIR 1D spectra. If you have questions about it, please contact the IRSA helpdesk.
Imports
# Uncomment the next line to install dependencies if needed
# !pip install matplotlib astropy 'astroquery>=0.4.10'
import numpy as np
import matplotlib.pyplot as plt
from astropy.io import fits
from astropy.table import QTable
from astropy import units as u
from astropy.coordinates import SkyCoord
from astropy.utils.data import conf
from astropy.visualization import quantity_support
from astroquery.ipac.irsa import Irsa
#suppress warnings about deprecated units
import warnings
warnings.filterwarnings(
"ignore",
message="The unit 'Angstrom' has been deprecated",
category=u.UnitsWarning,
)
warnings.filterwarnings(
"ignore",
message="The unit 'erg' has been deprecated",
category=u.UnitsWarning,
)
# The Euclid spectrum files are large and the time it takes to read
# them can exceed astropy's default timeout limit. Increase it.
conf.remote_timeout = 1201. Search for the spectrum of a specific galaxy
First, explore what Euclid catalogs are available. Note that we need to use the object ID for our targets to be able to download their spectrum.
Search for spectra collections in IRSA.
Irsa.list_collections(servicetype="ssa")euclid_ssa_collection = 'euclid_DpdSirCombinedSpectra'2. Search for the spectrum of a specific galaxy in the 1D spectra table
coord = SkyCoord(
    ra=269.7 * u.deg,
    dec=66.0 * u.deg
)

search_radius = 5.0 * u.arcsec
Query the IRSA SSA service for spectra near this position
ssa_result = Irsa.query_ssa(
    pos=coord,
    radius=search_radius,
    collection=euclid_ssa_collection,
)

#check whether any spectra were found
len(ssa_result)1Pull out the file name from the result table:
# Extract the single SSA result row
row = ssa_result[0]  #in case there is more than one spectra in the search radius


# Each SSA row provides a direct URL to the spectrum file
spectrum_path = row["access_url"]
spectrum_path'https://irsa.ipac.caltech.edu/api/spectrumdm/convert/euclid/q1/SIR/102159192/EUC_SIR_W-COMBSPEC_102159192_2024-11-05T16:13:03.659928Z.fits?dataset_id=euclid_combspec&hdu=372'3. Read in the spectrum for only our specific object
spectrum_path is a url that will return a VOTable containing the spectrum of our object.
spectrum = QTable.read(spectrum_path)spectrum4. Plot the image of the extracted spectrum
quantity_support()<astropy.visualization.units.quantity_support.<locals>.MplQuantityConverterFormatted at 0x7f49652b48c0>We investigate the MASK column to see which flux bins are recommended to keep vs “Do Not Use”
plt.plot(spectrum['WAVELENGTH'].to(u.micron), spectrum['MASK'])
plt.ylabel('Mask value')
plt.title('Values of MASK by flux bin')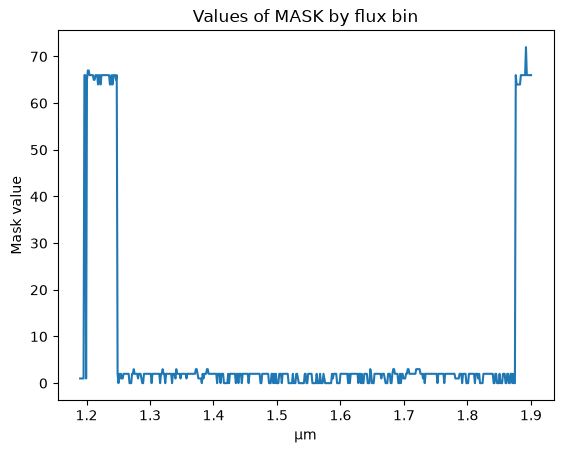
We use the MASK column to create a boolean mask for values to ignore. We use the inverse of this mask to mark the flux bins to use.
bad_mask = (spectrum['MASK'].value % 2 == 1) | (spectrum['MASK'].value >= 64)

plt.plot(spectrum['WAVELENGTH'].to(u.micron), np.ma.masked_where(bad_mask, spectrum['SIGNAL']), color='black', label='Spectrum')
plt.plot(spectrum['WAVELENGTH'], np.ma.masked_where(~bad_mask, spectrum['SIGNAL']), color='red', label='Do not use')
plt.plot(spectrum['WAVELENGTH'], np.sqrt(spectrum['VAR']), color='grey', label='Error')

plt.legend(loc='upper right')
plt.ylim(-0.15, 0.25)
plt.title(f"Euclid SIR 1D Spectrum at RA={coord.ra.deg:.4f}°, Dec={coord.dec.deg:.4f}°")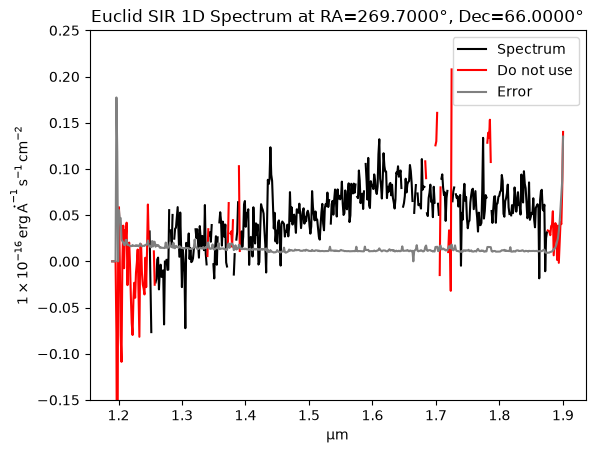
About this Notebook
Updated: 2026-01-13
Contact: the IRSA Helpdesk with questions or reporting problems.