Learning Goals
By the end of this tutorial, you will:
Understand the basic characteristics of Euclid Q1 MER catalogs.
What columns are available in the MER catalog.
How to query with ADQL in the MER catalog.
How to make a simple color-magnitude diagram with the data.
Introduction
Euclid launched in July 2023 as a European Space Agency (ESA) mission with involvement by NASA. The primary science goals of Euclid are to better understand the composition and evolution of the dark Universe. The Euclid mission is providing space-based imaging and spectroscopy as well as supporting ground-based imaging to achieve these primary goals. These data will be archived by multiple global repositories, including IRSA, where they will support transformational work in many areas of astrophysics.
Euclid Quick Release 1 (Q1) consists of consists of ~30 TB of imaging, spectroscopy, and catalogs covering four non-contiguous fields: Euclid Deep Field North (22.9 sq deg), Euclid Deep Field Fornax (12.1 sq deg), Euclid Deep Field South (28.1 sq deg), and LDN1641.
Among the data products included in the Q1 release are the three MER catalogs: the final catalog, the morphology catalog, and the cutouts catalog. This notebook provides an introduction to the MER final catalog. Each entry is a single source with associated photometry from the multiwavelength MER Mosaics (VIS, Y, J, H, and any accompanying external ground-based measurements), along with other basic measurements, like size and shape. If you have questions about this notebook, please contact the IRSA helpdesk.
Imports
# Uncomment the next line to install dependencies if needed
# !pip install numpy matplotlib 'astroquery>=0.4.10'
import numpy as np
import matplotlib.pyplot as plt
from astroquery.ipac.irsa import Irsa1. Download MER catalog from IRSA directly to this notebook
First, have a look at what Euclid catalogs are available. With the list_catalogs functionality, we’ll receive a list of the name of the catalogs as well as their brief desciption.
Irsa.list_catalogs(filter='euclid'){'euclid_q1_mer_catalogue': 'Euclid Q1 MER Catalog'}Choose the Euclid MER table
table_mer = 'euclid_q1_mer_catalogue'Learn some information about the MER catalog:
How many columns are there?
List the column names
columns_info = Irsa.list_columns(catalog=table_mer)
print(len(columns_info))
477
columns_infoDefine the following ADQL query to find the first 10k stars in the MER catalog
Since we are just using the MER catalog alone, it does not have a column for classification.
We can use the point_like_flag = 1 or point_like_prob > 0.99 for stars.
Set all the fluxes to be greater than 0 so the object is detected in all four Euclid MER mosaic images.
adql_stars = ("SELECT TOP 10000 mer.object_id, mer.ra, mer.dec, mer.flux_vis_psf, mer.fluxerr_vis_psf, "
              "mer.flux_y_templfit,mer.fluxerr_y_templfit, mer.flux_j_templfit, mer.fluxerr_j_templfit, "
              "mer.flux_h_templfit, mer.fluxerr_h_templfit, mer.point_like_prob, mer.extended_prob "
              f"FROM {table_mer} AS mer "
              "WHERE  mer.flux_vis_psf > 0 "
              "AND mer.flux_y_templfit > 0 "
              "AND mer.flux_j_templfit > 0 "
              "AND mer.flux_h_templfit > 0 "
              "AND mer.point_like_flag = 1 ")
We can run the query with the TAP service, and then look at some of the results.
result_stars = Irsa.query_tap(adql_stars).to_table()
result_stars[:5]2. Make a color-magnitude diagram using the catalogs pulled from IRSA
Convert from flux in uJy to magnitudes using the zero point correction
Convert the error bars to magnitudes as well
Plot the color-magnitude diagram
mag_y = -2.5 * np.log10(result_stars["flux_y_templfit"]) + 23.9
mag_h = -2.5 * np.log10(result_stars["flux_h_templfit"]) + 23.9

x = mag_y - mag_h  # Y - H
y = mag_y

xerr = (2.5 / np.log(10) * np.sqrt((result_stars["fluxerr_y_templfit"] / result_stars["flux_y_templfit"])**2
                                   + (result_stars["fluxerr_h_templfit"] / result_stars["flux_h_templfit"])**2))
yerr = (2.5 / np.log(10) * (result_stars["fluxerr_y_templfit"] / result_stars["flux_y_templfit"]))

plt.errorbar(x, y, xerr=xerr, yerr=yerr,
             fmt='o', markersize=1.5, ecolor='lightgrey', elinewidth=0.5, capsize=2)

plt.xlabel('Y-H')
plt.ylabel('Y')
# Note that these limits exclude a handful of points with large error bars.
plt.xlim(-2, 2)
plt.ylim(24, 16)
plt.title('10k Stars in MER catalog -- IRSA')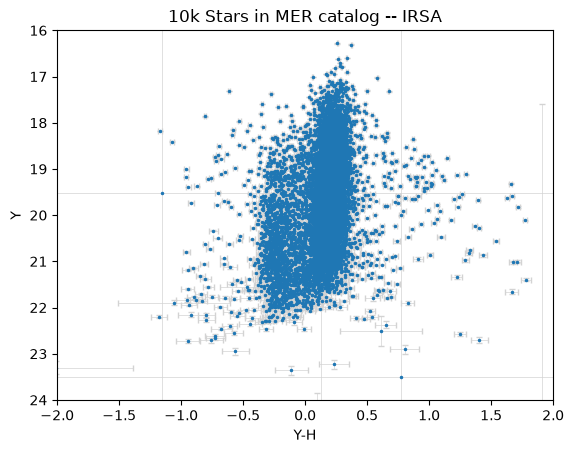
About this Notebook
Updated: 2025-04-09
Contact: the IRSA Helpdesk with questions or reporting problems.