Learning Goals
By the end of this tutorial, you will:
Understand the basic characteristics of Euclid Q1 SPE catalogs.
Understand what SPE catalogs are available and how to view the columns in those catalogs.
How to query with ADQL in the SPE lines catalog to find strong H-alpha detections.
How to make a plot the detected line features over the 1D spectra.
Introduction
Euclid launched in July 2023 as a European Space Agency (ESA) mission with involvement by NASA. The primary science goals of Euclid are to better understand the composition and evolution of the dark Universe. The Euclid mission is providing space-based imaging and spectroscopy as well as supporting ground-based imaging to achieve these primary goals. These data will be archived by multiple global repositories, including IRSA, where they will support transformational work in many areas of astrophysics.
Euclid Quick Release 1 (Q1) consists of consists of ~30 TB of imaging, spectroscopy, and catalogs covering four non-contiguous fields: Euclid Deep Field North (22.9 sq deg), Euclid Deep Field Fornax (12.1 sq deg), Euclid Deep Field South (28.1 sq deg), and LDN1641.
Among the data products included in the Q1 release are multiple catalogs created by the SPE Processing Function. This notebook provides an introduction to these SPE catalogs. If you have questions about this notebook, please contact the IRSA helpdesk.
Imports
# Uncomment the next line to install dependencies if needed
# %pip install matplotlib astropy 'astroquery>=0.4.10'
import matplotlib.pyplot as plt
import numpy as np
from astropy.coordinates import SkyCoord
from astropy.io import fits
from astropy.table import QTable
from astropy import units as u
from astropy.utils.data import conf, download_file
from astropy.visualization import ImageNormalize, PercentileInterval, AsinhStretch, quantity_support
from astroquery.ipac.irsa import Irsa
# The Euclid spectrum files are large and the time it takes to read
# them can exceed astropy's default timeout limit. Increase it.
conf.remote_timeout = 120
#suppress warnings about deprecated units and cache
import warnings
warnings.filterwarnings(
"ignore",
message="The unit 'Angstrom' has been deprecated",
category=u.UnitsWarning,
)
warnings.filterwarnings(
"ignore",
message="The unit 'erg' has been deprecated",
category=u.UnitsWarning,
)
warnings.filterwarnings(
"ignore",
message="XDG_CACHE_HOME is set",
)1. Find the MER Tile ID that corresponds to a given RA and Dec
In this case, choose the coordinates from the first notebook to save time downloading the MER mosaic. Search a radius of 1.5 arcminutes around these coordinates.
search_radius = 10 * u.arcsec
coord = SkyCoord.from_name('HD 168151')Use IRSA to search for all Euclid data on this target
This searches specifically in the euclid_DpdMerBksMosaic collection which is the MER images and catalogs.
image_table = Irsa.query_sia(pos=(coord, search_radius), collection='euclid_DpdMerBksMosaic')This table lists all MER mosaic images available in this search position. These mosaics include the Euclid VIS, Y, J, H images, as well as ground-based telescopes which have been put on the same pixel scale. For more information, see the Euclid documentation at IPAC.
Note that there are various image types are returned as well, we filter out the science images from these:
science_images = image_table[image_table['dataproduct_subtype'] == 'science']
science_imagesChoose the VIS image and pull the Tile ID
Extract the tile ID from the obs_id column. The values in this column are made a combination of the 9 digit tile ID and the abbreviation of the instrument.
tileID = science_images[science_images['energy_bandpassname'] == 'VIS']['obs_id'][0][:9]

print(f'The MER tile ID for this object is : {tileID}')
The MER tile ID for this object is : 102158277
2. Download SPE catalog from IRSA directly to this notebook
Search for all tables in IRSA labeled as euclid
Irsa.list_catalogs(filter='euclid'){'euclid_q1_mer_catalogue': 'Euclid Q1 MER Catalog'}table_mer = 'euclid_q1_mer_catalogue'
table_galaxy_candidates = 'euclid_q1_spectro_zcatalog_spe_galaxy_candidates'
table_1dspectra = 'euclid.objectid_spectrafile_association_q1'
table_lines = 'euclid_q1_spe_lines_line_features'Learn some information about the table:
How many columns are there?
List the column names
columns_info = Irsa.list_columns(catalog=table_mer)
print(len(columns_info))
477
Irsa.list_columns(catalog=table_1dspectra, full=True)# Full list of columns and their description
columns_info3. Find some objects with spectra in our tileID
We specify the following conditions on our search:
Signal to noise ratio column (_gf = gaussian fit) should be greater than 5
We want to detect H-alpha.
We choose in which tileID to search, usign the tileID from the first notebook.
Choose spectroscopic redshift (spe_z) between 1.4 and 1.6 and spe_z_prob greater than 0.999
H-alpha line flux should be more than 2x10^16 erg s^-1 cm^-2
Join the lines and galaxy candidates tables on object_id and spe_rank
Finally we sort the data by descending spe_line_snr_gf to have the largest SNR H-alpha lines detected at the top.
adql_query = ("SELECT DISTINCT mer.object_id,mer.ra, mer.dec, mer.tileid, mer.flux_y_templfit, "
    "lines.spe_line_snr_gf,lines.spe_line_snr_di, lines.spe_line_name, lines.spe_line_central_wl_gf, "
    "lines.spe_line_ew_gf, galaxy.spe_z_err, galaxy.spe_z,galaxy.spe_z_prob, "
    "lines.spe_line_flux_gf, lines.spe_line_flux_err_gf "
    f"FROM {table_mer} AS mer "
    f"JOIN {table_lines} AS lines "
    "ON mer.object_id = lines.object_id "
    f"JOIN {table_galaxy_candidates} AS galaxy "
    "ON lines.object_id = galaxy.object_id AND lines.spe_rank = galaxy.spe_rank "
    "WHERE lines.spe_line_snr_gf >5 "
    "AND lines.spe_line_name = 'Halpha' "
    f"AND mer.tileid = {tileID} "
    "AND galaxy.spe_z_prob > 0.99 "
    "AND galaxy.spe_z BETWEEN 1.4 AND 1.6 "
    "AND lines.spe_line_flux_gf > 2E-16 "
    "ORDER BY lines.spe_line_snr_gf DESC ")

# Use TAP with this ADQL string
result_table = Irsa.query_tap(adql_query).to_table()
Choose an object of interest, lets look at an object with a strong Halpha line detected with high SNR.
obj_id = 2737659721646729968

obj_row = result_table[(result_table['object_id'] == obj_id)]

obj_rowPull the spectrum of this object
# Query SSA for the 1D spectrum near this object's sky position
euclid_ssa_collection = "euclid_DpdSirCombinedSpectra"

# Use the object's MER coordinates from obj_row
coord_obj = SkyCoord(obj_row["ra"][0], obj_row["dec"][0], unit=u.deg)

#complete the query
ssa_result = Irsa.query_ssa(
    pos=coord_obj,
    radius=2.0 * u.arcsec,
    collection=euclid_ssa_collection,
)

ssa_resultThe following steps to read in the spectrum follows the 3_Euclid_intro_1D_spectra notebook.
# Read in the spectrum for this object from the SSA access URL
spectrum_path = ssa_result["access_url"][0]
spectrum_path'https://irsa.ipac.caltech.edu/api/spectrumdm/convert/euclid/q1/SIR/102158277/EUC_SIR_W-COMBSPEC_102158277_2024-11-05T15:54:09.376202Z.fits?dataset_id=euclid_combspec&hdu=1179'spectrum = QTable.read(spectrum_path)Now the data are read in, plot the spectrum with the H-alpha line labeled
quantity_support()<astropy.visualization.units.quantity_support.<locals>.MplQuantityConverter at 0x7fe3f1ba1a60># Note that the units are missing from the lines table, we manually add Angstrom
line_wavelengths = obj_row['spe_line_central_wl_gf'] * u.angstrom
line_names = obj_row['spe_line_name']
snr_gf = obj_row['spe_line_snr_gf']
plt.plot(spectrum['WAVELENGTH'].to(u.micron), spectrum['SIGNAL'])
for wl, name, snr in zip(np.atleast_1d(line_wavelengths), np.atleast_1d(line_names), np.atleast_1d(snr_gf)):
plt.axvline(wl, color='b', linestyle='--', alpha=0.3)
plt.text(wl, .2, name+' SNR='+str(round(snr)), rotation=90, ha='center', va='bottom', fontsize=10)
plt.title(f'Object ID {obj_id}')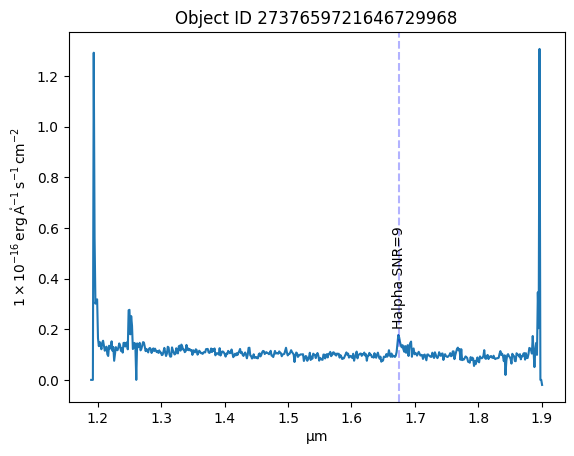
About this Notebook
Updated: 2026-01-13
Contact: the IRSA Helpdesk with questions or reporting problems.
Runtime: As of the date above, this notebook takes about 90 seconds to run to completion on a machine with 8GB RAM and 4 CPU.