Euclid Q1: SPE catalogs#
Learning Goals#
By the end of this tutorial, you will:
Understand the basic characteristics of Euclid Q1 SPE catalogs.
Understand what SPE catalogs are available and how to view the columns in those catalogs.
How to query with ADQL in the SPE lines catalog to find strong H-alpha detections.
How to make a plot the detected line features over the 1D spectra.
Introduction#
Euclid launched in July 2023 as a European Space Agency (ESA) mission with involvement by NASA. The primary science goals of Euclid are to better understand the composition and evolution of the dark Universe. The Euclid mission is providing space-based imaging and spectroscopy as well as supporting ground-based imaging to achieve these primary goals. These data will be archived by multiple global repositories, including IRSA, where they will support transformational work in many areas of astrophysics.
Euclid Quick Release 1 (Q1) consists of consists of ~30 TB of imaging, spectroscopy, and catalogs covering four non-contiguous fields: Euclid Deep Field North (22.9 sq deg), Euclid Deep Field Fornax (12.1 sq deg), Euclid Deep Field South (28.1 sq deg), and LDN1641.
Among the data products included in the Q1 release are multiple catalogs created by the SPE Processing Function. This notebook provides an introduction to these SPE catalogs. If you have questions about this notebook, please contact the IRSA helpdesk.
Imports#
Important
We rely on astroquery features that have been recently added, so please make sure you have version v0.4.10 or newer installed.
# Uncomment the next line to install dependencies if needed
# !pip install matplotlib astropy 'astroquery>=0.4.10'
import re
import urllib

import matplotlib.pyplot as plt
import numpy as np

from astropy.coordinates import SkyCoord
from astropy.io import fits
from astropy.table import QTable
from astropy import units as u
from astropy.utils.data import download_file
from astropy.visualization import ImageNormalize, PercentileInterval, AsinhStretch, quantity_support

from astroquery.ipac.irsa import Irsa
1. Find the MER Tile ID that corresponds to a given RA and Dec#
In this case, choose the coordinates from the first notebook to save time downloading the MER mosaic. Search a radius of 1.5 arcminutes around these coordinates.
search_radius = 10 * u.arcsec
coord = SkyCoord.from_name('HD 168151')
Tip
The IRSA SIA collections can be listed using using the list_collections method, we can filter on the ones containing “euclid” in the collection name:
Irsa.list_collections(filter='euclid')
Use IRSA to search for all Euclid data on this target#
This searches specifically in the euclid_DpdMerBksMosaic collection which is the MER images and catalogs.
image_table = Irsa.query_sia(pos=(coord, search_radius), collection='euclid_DpdMerBksMosaic')
This table lists all MER mosaic images available in this search position. These mosaics include the Euclid VIS, Y, J, H images, as well as ground-based telescopes which have been put on the same pixel scale. For more information, see the Euclid documentation at IPAC.
Note that there are various image types are returned as well, we filter out the science images from these:
science_images = image_table[image_table['dataproduct_subtype'] == 'science']
science_images
| s_ra | s_dec | facility_name | instrument_name | dataproduct_subtype | calib_level | dataproduct_type | energy_bandpassname | energy_emband | obs_id | s_resolution | em_min | em_max | em_res_power | proposal_title | access_url | access_format | access_estsize | t_exptime | s_region | obs_collection | obs_intent | algorithm_name | facility_keywords | instrument_keywords | environment_photometric | proposal_id | proposal_pi | proposal_project | target_name | target_type | target_standard | target_moving | target_keywords | obs_release_date | s_xel1 | s_xel2 | s_pixel_scale | position_timedependent | t_min | t_max | t_resolution | t_xel | obs_publisher_did | s_fov | em_xel | pol_states | pol_xel | cloud_access | o_ucd | upload_row_id |
|---|---|---|---|---|---|---|---|---|---|---|---|---|---|---|---|---|---|---|---|---|---|---|---|---|---|---|---|---|---|---|---|---|---|---|---|---|---|---|---|---|---|---|---|---|---|---|---|---|---|---|
| deg | deg | arcsec | m | m | kbyte | s | deg | arcsec | d | d | s | deg | ||||||||||||||||||||||||||||||||||||||
| float64 | float64 | object | object | object | int16 | object | object | object | object | float64 | float64 | float64 | float64 | object | object | object | int64 | float64 | object | object | object | object | object | object | bool | object | object | object | object | object | bool | bool | object | object | int64 | int64 | float64 | bool | float64 | float64 | float64 | int64 | object | float64 | int64 | object | int64 | object | object | int64 |
| 273.74061163858784 | 64.50001388888538 | Euclid | NISP | science | 3 | image | J | Infrared | 102158277_NISP | 0.094 | 1.146e-06 | 1.372e-06 | 5.6 | Euclid on-the-fly | https://irsa.ipac.caltech.edu/ibe/data/euclid/q1/MER/102158277/NISP/EUC_MER_BGSUB-MOSAIC-NIR-J_TILE102158277-DA51EA_20241025T122533.612365Z_00.00.fits | image/fits | 1474566 | -- | POLYGON ICRS 274.366109291086 64.76536207691132 273.11511335805267 64.76536180261205 273.1272020139886 64.23206348982802 274.3540218940251 64.23206375763488 274.366109291086 64.76536207691132 | euclid_DpdMerBksMosaic | SCIENCE | mosaic | -- | field | -- | False | 2025-05-01 00:00:00 | 19200 | 19200 | 0.100000000000008 | False | -- | -- | -- | -- | ivo://irsa.ipac/euclid_DpdMerBksMosaic?102158277_NISP/J | 0.533333333333376 | -- | -- | {"aws": {"bucket_name": "nasa-irsa-euclid-q1", "key":"q1/MER/102158277/NISP/EUC_MER_BGSUB-MOSAIC-NIR-J_TILE102158277-DA51EA_20241025T122533.612365Z_00.00.fits", "region": "us-east-1"}} | 1 | |||||||||
| 273.74061163858784 | 64.50001388888538 | Euclid | NISP | science | 3 | image | Y | Infrared | 102158277_NISP | 0.0878 | 9.2e-07 | 1.146e-06 | 4.6 | Euclid on-the-fly | https://irsa.ipac.caltech.edu/ibe/data/euclid/q1/MER/102158277/NISP/EUC_MER_BGSUB-MOSAIC-NIR-Y_TILE102158277-1FE0D9_20241025T122512.777703Z_00.00.fits | image/fits | 1474566 | -- | POLYGON ICRS 274.366109291086 64.76536207691132 273.11511335805267 64.76536180261205 273.1272020139886 64.23206348982802 274.3540218940251 64.23206375763488 274.366109291086 64.76536207691132 | euclid_DpdMerBksMosaic | SCIENCE | mosaic | -- | field | -- | False | 2025-05-01 00:00:00 | 19200 | 19200 | 0.100000000000008 | False | -- | -- | -- | -- | ivo://irsa.ipac/euclid_DpdMerBksMosaic?102158277_NISP/Y | 0.533333333333376 | -- | -- | {"aws": {"bucket_name": "nasa-irsa-euclid-q1", "key":"q1/MER/102158277/NISP/EUC_MER_BGSUB-MOSAIC-NIR-Y_TILE102158277-1FE0D9_20241025T122512.777703Z_00.00.fits", "region": "us-east-1"}} | 1 | |||||||||
| 273.74061163858784 | 64.50001388888538 | Euclid | NISP | science | 3 | image | H | Infrared | 102158277_NISP | 0.1026 | 1.372e-06 | 2e-06 | 2.7 | Euclid on-the-fly | https://irsa.ipac.caltech.edu/ibe/data/euclid/q1/MER/102158277/NISP/EUC_MER_BGSUB-MOSAIC-NIR-H_TILE102158277-797A7D_20241025T122514.635323Z_00.00.fits | image/fits | 1474566 | -- | POLYGON ICRS 274.366109291086 64.76536207691132 273.11511335805267 64.76536180261205 273.1272020139886 64.23206348982802 274.3540218940251 64.23206375763488 274.366109291086 64.76536207691132 | euclid_DpdMerBksMosaic | SCIENCE | mosaic | -- | field | -- | False | 2025-05-01 00:00:00 | 19200 | 19200 | 0.100000000000008 | False | -- | -- | -- | -- | ivo://irsa.ipac/euclid_DpdMerBksMosaic?102158277_NISP/H | 0.533333333333376 | -- | -- | {"aws": {"bucket_name": "nasa-irsa-euclid-q1", "key":"q1/MER/102158277/NISP/EUC_MER_BGSUB-MOSAIC-NIR-H_TILE102158277-797A7D_20241025T122514.635323Z_00.00.fits", "region": "us-east-1"}} | 1 | |||||||||
| 273.74061163858784 | 64.50001388888538 | Pan-STARRS | Pan-STARRS | science | 3 | image | I | Optical | 102158277_PANSTARRS | 1.11 | 6.78317e-07 | 8.30624e-07 | 5.0 | Euclid on-the-fly | https://irsa.ipac.caltech.edu/ibe/data/euclid/q1/MER/102158277/GPC/EUC_MER_BGSUB-MOSAIC-PANSTARRS-I_TILE102158277-C2B970_20241025T120200.727193Z_00.00.fits | image/fits | 1474566 | -- | POLYGON ICRS 274.366109291086 64.76536207691132 273.11511335805267 64.76536180261205 273.1272020139886 64.23206348982802 274.3540218940251 64.23206375763488 274.366109291086 64.76536207691132 | euclid_DpdMerBksMosaic | SCIENCE | mosaic | -- | field | -- | False | 2025-05-01 00:00:00 | 19200 | 19200 | 0.100000000000008 | False | -- | -- | -- | -- | ivo://irsa.ipac/euclid_DpdMerBksMosaic?102158277_PANSTARRS/I | 0.533333333333376 | -- | -- | {"aws": {"bucket_name": "nasa-irsa-euclid-q1", "key":"q1/MER/102158277/GPC/EUC_MER_BGSUB-MOSAIC-PANSTARRS-I_TILE102158277-C2B970_20241025T120200.727193Z_00.00.fits", "region": "us-east-1"}} | 1 | |||||||||
| 273.74061163858784 | 64.50001388888538 | Euclid | VIS | science | 3 | image | VIS | Optical | 102158277_VIS | 0.16 | 5.5e-07 | 9e-07 | 2.1 | Euclid on-the-fly | https://irsa.ipac.caltech.edu/ibe/data/euclid/q1/MER/102158277/VIS/EUC_MER_BGSUB-MOSAIC-VIS_TILE102158277-27C4DD_20241025T124812.358980Z_00.00.fits | image/fits | 1474566 | -- | POLYGON ICRS 274.366109291086 64.76536207691132 273.11511335805267 64.76536180261205 273.1272020139886 64.23206348982802 274.3540218940251 64.23206375763488 274.366109291086 64.76536207691132 | euclid_DpdMerBksMosaic | SCIENCE | mosaic | -- | field | -- | False | 2025-05-01 00:00:00 | 19200 | 19200 | 0.100000000000008 | False | -- | -- | -- | -- | ivo://irsa.ipac/euclid_DpdMerBksMosaic?102158277_VIS/VIS | 0.533333333333376 | -- | -- | {"aws": {"bucket_name": "nasa-irsa-euclid-q1", "key":"q1/MER/102158277/VIS/EUC_MER_BGSUB-MOSAIC-VIS_TILE102158277-27C4DD_20241025T124812.358980Z_00.00.fits", "region": "us-east-1"}} | 1 | |||||||||
| 273.74061163858784 | 64.50001388888538 | CFHT | MegaCam | science | 3 | image | R | Optical | 102158277_MegaCam | -- | 5.61762e-07 | 7.22025e-07 | 4.0 | Euclid on-the-fly | https://irsa.ipac.caltech.edu/ibe/data/euclid/q1/MER/102158277/MEGACAM/EUC_MER_BGSUB-MOSAIC-CFIS-R_TILE102158277-CA7AB3_20241025T120300.417407Z_00.00.fits | image/fits | 1474566 | -- | POLYGON ICRS 274.366109291086 64.76536207691132 273.11511335805267 64.76536180261205 273.1272020139886 64.23206348982802 274.3540218940251 64.23206375763488 274.366109291086 64.76536207691132 | euclid_DpdMerBksMosaic | SCIENCE | mosaic | -- | field | -- | False | 2025-05-01 00:00:00 | 19200 | 19200 | 0.100000000000008 | False | -- | -- | -- | -- | ivo://irsa.ipac/euclid_DpdMerBksMosaic?102158277_MegaCam/R | 0.533333333333376 | -- | -- | {"aws": {"bucket_name": "nasa-irsa-euclid-q1", "key":"q1/MER/102158277/MEGACAM/EUC_MER_BGSUB-MOSAIC-CFIS-R_TILE102158277-CA7AB3_20241025T120300.417407Z_00.00.fits", "region": "us-east-1"}} | 1 | |||||||||
| 273.74061163858784 | 64.50001388888538 | CFHT | MegaCam | science | 3 | image | U | Optical | 102158277_MegaCam | -- | 3.14751e-07 | 4.01839e-07 | 4.1 | Euclid on-the-fly | https://irsa.ipac.caltech.edu/ibe/data/euclid/q1/MER/102158277/MEGACAM/EUC_MER_BGSUB-MOSAIC-CFIS-U_TILE102158277-DB8920_20241025T120138.608462Z_00.00.fits | image/fits | 1474566 | -- | POLYGON ICRS 274.366109291086 64.76536207691132 273.11511335805267 64.76536180261205 273.1272020139886 64.23206348982802 274.3540218940251 64.23206375763488 274.366109291086 64.76536207691132 | euclid_DpdMerBksMosaic | SCIENCE | mosaic | -- | field | -- | False | 2025-05-01 00:00:00 | 19200 | 19200 | 0.100000000000008 | False | -- | -- | -- | -- | ivo://irsa.ipac/euclid_DpdMerBksMosaic?102158277_MegaCam/U | 0.533333333333376 | -- | -- | {"aws": {"bucket_name": "nasa-irsa-euclid-q1", "key":"q1/MER/102158277/MEGACAM/EUC_MER_BGSUB-MOSAIC-CFIS-U_TILE102158277-DB8920_20241025T120138.608462Z_00.00.fits", "region": "us-east-1"}} | 1 | |||||||||
| 273.74061163858784 | 64.50001388888538 | Subaru Telescope | Hyper Suprime-Cam | science | 3 | image | G | Optical | 102158277_WISHES | 1.58 | 3.95422e-07 | 5.54729e-07 | 3.0 | Euclid on-the-fly | https://irsa.ipac.caltech.edu/ibe/data/euclid/q1/MER/102158277/HSC/EUC_MER_BGSUB-MOSAIC-WISHES-G_TILE102158277-76C6DB_20241025T120401.488065Z_00.00.fits | image/fits | 1474566 | -- | POLYGON ICRS 274.366109291086 64.76536207691132 273.11511335805267 64.76536180261205 273.1272020139886 64.23206348982802 274.3540218940251 64.23206375763488 274.366109291086 64.76536207691132 | euclid_DpdMerBksMosaic | SCIENCE | mosaic | -- | field | -- | False | 2025-05-01 00:00:00 | 19200 | 19200 | 0.100000000000008 | False | -- | -- | -- | -- | ivo://irsa.ipac/euclid_DpdMerBksMosaic?102158277_WISHES/G | 0.533333333333376 | -- | -- | {"aws": {"bucket_name": "nasa-irsa-euclid-q1", "key":"q1/MER/102158277/HSC/EUC_MER_BGSUB-MOSAIC-WISHES-G_TILE102158277-76C6DB_20241025T120401.488065Z_00.00.fits", "region": "us-east-1"}} | 1 | |||||||||
| 273.74061163858784 | 64.50001388888538 | Subaru Telescope | Hyper Suprime-Cam | science | 3 | image | Z | Optical | 102158277_WISHES | 1.15 | 8.36385e-07 | 9.49057e-07 | 7.9 | Euclid on-the-fly | https://irsa.ipac.caltech.edu/ibe/data/euclid/q1/MER/102158277/HSC/EUC_MER_BGSUB-MOSAIC-WISHES-Z_TILE102158277-E3133D_20241025T120342.580582Z_00.00.fits | image/fits | 1474566 | -- | POLYGON ICRS 274.366109291086 64.76536207691132 273.11511335805267 64.76536180261205 273.1272020139886 64.23206348982802 274.3540218940251 64.23206375763488 274.366109291086 64.76536207691132 | euclid_DpdMerBksMosaic | SCIENCE | mosaic | -- | field | -- | False | 2025-05-01 00:00:00 | 19200 | 19200 | 0.100000000000008 | False | -- | -- | -- | -- | ivo://irsa.ipac/euclid_DpdMerBksMosaic?102158277_WISHES/Z | 0.533333333333376 | -- | -- | {"aws": {"bucket_name": "nasa-irsa-euclid-q1", "key":"q1/MER/102158277/HSC/EUC_MER_BGSUB-MOSAIC-WISHES-Z_TILE102158277-E3133D_20241025T120342.580582Z_00.00.fits", "region": "us-east-1"}} | 1 |
Choose the VIS image and pull the Tile ID#
Extract the tile ID from the obs_id column. The values in this column are made a combination of the 9 digit tile ID and the abbreviation of the instrument.
tileID = science_images[science_images['energy_bandpassname'] == 'VIS']['obs_id'][0][:9]

print(f'The MER tile ID for this object is : {tileID}')
The MER tile ID for this object is : 102158277
2. Download SPE catalog from IRSA directly to this notebook#
Search for all tables in IRSA labeled as euclid
Irsa.list_catalogs(filter='euclid')
{'euclid.tileid_association_q1': 'Euclid Q1 TILEID to Observation ID Association Table',
 'euclid.objectid_spectrafile_association_q1': 'Euclid Q1 Object ID to Spectral File Association Table',
 'euclid.observation_euclid_q1': 'Euclid Q1 CAOM Observation Table',
 'euclid.plane_euclid_q1': 'Euclid Q1 CAOM Plane Table',
 'euclid.artifact_euclid_q1': 'Euclid Q1 CAOM Artifact Table',
 'euclid_q1_mer_catalogue': 'Euclid Q1 MER Catalog',
 'euclid_q1_mer_morphology': 'Euclid Q1 MER Morphology',
 'euclid_q1_mer_cutouts': 'Euclid Q1 MER Cutouts',
 'euclid_q1_phz_photo_z': 'Euclid Q1 PHZ Photo-z Catalog',
 'euclid_q1_phz_star_sed': 'Euclid Q1 PHZ Star SED Catalog',
 'euclid_q1_phz_galaxy_sed': 'Euclid Q1 PHZ Galaxy SED Catalog',
 'euclid_q1_phz_classification': 'Euclid Q1 PHZ Classification Catalog',
 'euclid_q1_phz_qso_physical_parameters': 'Euclid Q1 PHZ QSO Physical Parameters Catalog',
 'euclid_q1_phz_nir_physical_parameters': 'Euclid Q1 PHZ NIR Physical Parameters Catalog',
 'euclid_q1_phz_star_template': 'Euclid Q1 PHZ Star Template Catalog',
 'euclid_q1_spectro_zcatalog_spe_quality': 'Euclid Q1 SPE Redshift Catalog - Quality',
 'euclid_q1_spectro_zcatalog_spe_classification': 'Euclid Q1 SPE Redshift Catalog - Classification',
 'euclid_q1_spectro_zcatalog_spe_galaxy_candidates': 'Euclid Q1 SPE Redshift Catalog - Galaxy Candidates',
 'euclid_q1_spectro_zcatalog_spe_star_candidates': 'Euclid Q1 SPE Redshift Catalog - Star Candidates',
 'euclid_q1_spectro_zcatalog_spe_qso_candidates': 'Euclid Q1 SPE Redshift Catalog - QSO Candidates',
 'euclid_q1_spe_lines_line_features': 'Euclid Q1 SPE Lines Catalog - Spectral Lines',
 'euclid_q1_spe_lines_continuum_features': 'Euclid Q1 SPE Lines Catalog - Continuum Features',
 'euclid_q1_spe_lines_atomic_indices': 'Euclid Q1 SPE Lines Catalog - Atomic Indices',
 'euclid_q1_spe_lines_molecular_indices': 'Euclid Q1 SPE Lines Catalog - Molecular Indices',
 'euclid_q1_spectro_model_catalog_spe_lines_catalog': 'Euclid Q1 SPE Models Catalog - Lines',
 'euclid_q1_spectro_model_catalog_spe_star_models': 'Euclid Q1 SPE Star Models Catalog'}
table_mer = 'euclid_q1_mer_catalogue'
table_galaxy_candidates = 'euclid_q1_spectro_zcatalog_spe_galaxy_candidates'
table_1dspectra = 'euclid.objectid_spectrafile_association_q1'
table_lines = 'euclid_q1_spe_lines_line_features'
Learn some information about the table:#
How many columns are there?
List the column names
columns_info = Irsa.list_columns(catalog=table_mer)
print(len(columns_info))
477
Irsa.list_columns(catalog=table_1dspectra, full=True)
| column_index | schema_name | irsa_schema_name | table_name | column_name | description | unit | ucd | utype | datatype | arraysize | size | principal | indexed | std | irsa_label | xtype | irsa_format | irsa_ref |
|---|---|---|---|---|---|---|---|---|---|---|---|---|---|---|---|---|---|---|
| int32 | object | object | object | object | object | object | object | object | object | int32 | int32 | int32 | int32 | int32 | object | object | object | object |
| 1 | euclid | euclid | euclid.objectid_spectrafile_association_q1 | objectid | Euclid Object ID | long | 1 | 1 | 1 | 0 | 0 | objectid | 20d | |||||
| 2 | euclid | euclid | euclid.objectid_spectrafile_association_q1 | tileid | Euclid Tile ID | long | 1 | 1 | 1 | 0 | 0 | tileid | 20d | |||||
| 3 | euclid | euclid | euclid.objectid_spectrafile_association_q1 | uri | Relative path to combined spectrum file containing spectrum for objectid | char | 1 | 1 | 1 | 0 | 0 | uri | 151.151s | |||||
| 4 | euclid | euclid | euclid.objectid_spectrafile_association_q1 | hdu | HDU of combined spectrum file containing spectrum for objectid | long | 1 | 1 | 1 | 0 | 0 | hdu | 20d | |||||
| 5 | euclid | euclid | euclid.objectid_spectrafile_association_q1 | cntr | entry counter (key) number (unique within table) | meta.record;meta.main | long | 1 | 1 | 0 | 1 | 0 | cntr | 12d |
# Full list of columns and their description
columns_info
{'object_id': 'Euclid unique source identifier',
 'ra': 'Source barycenter RA coordinate (SExtractor ALPHA_J2000) decimal degrees',
 'dec': 'Source barycenter DEC coordinate (SExtractor DELTA_J2000) decimal degrees',
 'right_ascension_psf_fitting': 'Source RA coordinate derived by the PSF-fitting photometry method',
 'declination_psf_fitting': 'Source DEC coordinate derived by the PSF-fitting photometry method',
 'segmentation_map_id': 'Source ID in the associated segmentation map',
 'vis_det': 'Flag to indicate if the source is detected in the VIS mosaic (1) or is only detected in the NIR mosaic (0)',
 'flux_vis_1fwhm_aper': 'VIS band source aperture photometry flux (1 FWHM diameter) on PSF-matched images',
 'flux_vis_2fwhm_aper': 'VIS band source aperture photometry flux (2 FWHM diameter) on PSF-matched images',
 'flux_vis_3fwhm_aper': 'VIS band source aperture photometry flux (3 FWHM diameter) on PSF-matched images',
 'flux_vis_4fwhm_aper': 'VIS band source aperture photometry flux (4 FWHM diameter) on PSF-matched images',
 'flux_y_1fwhm_aper': 'NIR Y band source aperture photometry flux (1 FWHM diameter) on PSF-matched images',
 'flux_y_2fwhm_aper': 'NIR Y band source aperture photometry flux (2 FWHM diameter) on PSF-matched images',
 'flux_y_3fwhm_aper': 'NIR Y band source aperture photometry flux (3 FWHM diameter) on PSF-matched images',
 'flux_y_4fwhm_aper': 'NIR Y band source aperture photometry flux (4 FWHM diameter) on PSF-matched images',
 'flux_j_1fwhm_aper': 'NIR J band source aperture photometry flux (1 FWHM diameter) on PSF-matched images',
 'flux_j_2fwhm_aper': 'NIR J band source aperture photometry flux (2 FWHM diameter) on PSF-matched images',
 'flux_j_3fwhm_aper': 'NIR J band source aperture photometry flux (3 FWHM diameter) on PSF-matched images',
 'flux_j_4fwhm_aper': 'NIR J band source aperture photometry flux (4 FWHM diameter) on PSF-matched images',
 'flux_h_1fwhm_aper': 'NIR H band source aperture photometry flux (1 FWHM diameter) on PSF-matched images',
 'flux_h_2fwhm_aper': 'NIR H band source aperture photometry flux (2 FWHM diameter) on PSF-matched images',
 'flux_h_3fwhm_aper': 'NIR H band source aperture photometry flux (3 FWHM diameter) on PSF-matched images',
 'flux_h_4fwhm_aper': 'NIR H band source aperture photometry flux (4 FWHM diameter) on PSF-matched images',
 'flux_nir_stack_1fwhm_aper': 'NIR stack band source aperture photometry flux (1 FWHM diameter) on PSF-matched images',
 'flux_nir_stack_2fwhm_aper': 'NIR stack band source aperture photometry flux (2 FWHM diameter) on PSF-matched images',
 'flux_nir_stack_3fwhm_aper': 'NIR stack band source aperture photometry flux (3 FWHM diameter) on PSF-matched images',
 'flux_nir_stack_4fwhm_aper': 'NIR stack band source aperture photometry flux (4 FWHM diameter) on PSF-matched images',
 'flux_u_ext_decam_1fwhm_aper': 'Uext DECam band source aperture photometry flux (1 FWHM diameter) on PSF-matched images',
 'flux_u_ext_decam_2fwhm_aper': 'Uext DECam band source aperture photometry flux (2 FWHM diameter) on PSF-matched images',
 'flux_u_ext_decam_3fwhm_aper': 'Uext DECam band source aperture photometry flux (3 FWHM diameter) on PSF-matched images',
 'flux_u_ext_decam_4fwhm_aper': 'Uext DECam band source aperture photometry flux (4 FWHM diameter) on PSF-matched images',
 'flux_g_ext_decam_1fwhm_aper': 'Gext DECam band source aperture photometry flux (1 FWHM diameter) on PSF-matched images',
 'flux_g_ext_decam_2fwhm_aper': 'Gext DECam band source aperture photometry flux (2 FWHM diameter) on PSF-matched images',
 'flux_g_ext_decam_3fwhm_aper': 'Gext DECam band source aperture photometry flux (3 FWHM diameter) on PSF-matched images',
 'flux_g_ext_decam_4fwhm_aper': 'Gext DECam band source aperture photometry flux (4 FWHM diameter) on PSF-matched images',
 'flux_r_ext_decam_1fwhm_aper': 'Rext DECam band source aperture photometry flux (1 FWHM diameter) on PSF-matched images',
 'flux_r_ext_decam_2fwhm_aper': 'Rext DECam band source aperture photometry flux (2 FWHM diameter) on PSF-matched images',
 'flux_r_ext_decam_3fwhm_aper': 'Rext DECam band source aperture photometry flux (3 FWHM diameter) on PSF-matched images',
 'flux_r_ext_decam_4fwhm_aper': 'Rext DECam band source aperture photometry flux (4 FWHM diameter) on PSF-matched images',
 'flux_i_ext_decam_1fwhm_aper': 'Iext DECam band source aperture photometry flux (1 FWHM diameter) on PSF-matched images',
 'flux_i_ext_decam_2fwhm_aper': 'Iext DECam band source aperture photometry flux (2 FWHM diameter) on PSF-matched images',
 'flux_i_ext_decam_3fwhm_aper': 'Iext DECam band source aperture photometry flux (3 FWHM diameter) on PSF-matched images',
 'flux_i_ext_decam_4fwhm_aper': 'Iext DECam band source aperture photometry flux (4 FWHM diameter) on PSF-matched images',
 'flux_z_ext_decam_1fwhm_aper': 'Zext DECam band source aperture photometry flux (1 FWHM diameter) on PSF-matched images',
 'flux_z_ext_decam_2fwhm_aper': 'Zext DECam band source aperture photometry flux (2 FWHM diameter) on PSF-matched images',
 'flux_z_ext_decam_3fwhm_aper': 'Zext DECam band source aperture photometry flux (3 FWHM diameter) on PSF-matched images',
 'flux_z_ext_decam_4fwhm_aper': 'Zext DECam band source aperture photometry flux (4 FWHM diameter) on PSF-matched images',
 'flux_u_ext_lsst_1fwhm_aper': 'Uext LSST band source aperture photometry flux (1 FWHM diameter) on PSF-matched images',
 'flux_u_ext_lsst_2fwhm_aper': 'Uext LSST band source aperture photometry flux (2 FWHM diameter) on PSF-matched images',
 'flux_u_ext_lsst_3fwhm_aper': 'Uext LSST band source aperture photometry flux (3 FWHM diameter) on PSF-matched images',
 'flux_u_ext_lsst_4fwhm_aper': 'Uext LSST band source aperture photometry flux (4 FWHM diameter) on PSF-matched images',
 'flux_g_ext_lsst_1fwhm_aper': 'Gext LSST band source aperture photometry flux (1 FWHM diameter) on PSF-matched images',
 'flux_g_ext_lsst_2fwhm_aper': 'Gext LSST band source aperture photometry flux (2 FWHM diameter) on PSF-matched images',
 'flux_g_ext_lsst_3fwhm_aper': 'Gext LSST band source aperture photometry flux (3 FWHM diameter) on PSF-matched images',
 'flux_g_ext_lsst_4fwhm_aper': 'Gext LSST band source aperture photometry flux (4 FWHM diameter) on PSF-matched images',
 'flux_r_ext_lsst_1fwhm_aper': 'Rext LSST band source aperture photometry flux (1 FWHM diameter) on PSF-matched images',
 'flux_r_ext_lsst_2fwhm_aper': 'Rext LSST band source aperture photometry flux (2 FWHM diameter) on PSF-matched images',
 'flux_r_ext_lsst_3fwhm_aper': 'Rext LSST band source aperture photometry flux (3 FWHM diameter) on PSF-matched images',
 'flux_r_ext_lsst_4fwhm_aper': 'Rext LSST band source aperture photometry flux (4 FWHM diameter) on PSF-matched images',
 'flux_i_ext_lsst_1fwhm_aper': 'Iext LSST band source aperture photometry flux (1 FWHM diameter) on PSF-matched images',
 'flux_i_ext_lsst_2fwhm_aper': 'Iext LSST band source aperture photometry flux (2 FWHM diameter) on PSF-matched images',
 'flux_i_ext_lsst_3fwhm_aper': 'Iext LSST band source aperture photometry flux (3 FWHM diameter) on PSF-matched images',
 'flux_i_ext_lsst_4fwhm_aper': 'Iext LSST band source aperture photometry flux (4 FWHM diameter) on PSF-matched images',
 'flux_z_ext_lsst_1fwhm_aper': 'Zext LSST band source aperture photometry flux (1 FWHM diameter) on PSF-matched images',
 'flux_z_ext_lsst_2fwhm_aper': 'Zext LSST band source aperture photometry flux (2 FWHM diameter) on PSF-matched images',
 'flux_z_ext_lsst_3fwhm_aper': 'Zext LSST band source aperture photometry flux (3 FWHM diameter) on PSF-matched images',
 'flux_z_ext_lsst_4fwhm_aper': 'Zext LSST band source aperture photometry flux (4 FWHM diameter) on PSF-matched images',
 'flux_u_ext_megacam_1fwhm_aper': 'Uext Megacam band source aperture photometry flux (1 FWHM diameter) on PSF-matched images',
 'flux_u_ext_megacam_2fwhm_aper': 'Uext Megacam band source aperture photometry flux (2 FWHM diameter) on PSF-matched images',
 'flux_u_ext_megacam_3fwhm_aper': 'Uext Megacam band source aperture photometry flux (3 FWHM diameter) on PSF-matched images',
 'flux_u_ext_megacam_4fwhm_aper': 'Uext Megacam band source aperture photometry flux (4 FWHM diameter) on PSF-matched images',
 'flux_r_ext_megacam_1fwhm_aper': 'Rext Megacam band source aperture photometry flux (1 FWHM diameter) on PSF-matched images',
 'flux_r_ext_megacam_2fwhm_aper': 'Rext Megacam band source aperture photometry flux (2 FWHM diameter) on PSF-matched images',
 'flux_r_ext_megacam_3fwhm_aper': 'Rext Megacam band source aperture photometry flux (3 FWHM diameter) on PSF-matched images',
 'flux_r_ext_megacam_4fwhm_aper': 'Rext Megacam band source aperture photometry flux (4 FWHM diameter) on PSF-matched images',
 'flux_g_ext_jpcam_1fwhm_aper': 'Gext JPCAM band source aperture photometry flux (1 FWHM diameter) on PSF-matched images',
 'flux_g_ext_jpcam_2fwhm_aper': 'Gext JPCAM band source aperture photometry flux (2 FWHM diameter) on PSF-matched images',
 'flux_g_ext_jpcam_3fwhm_aper': 'Gext JPCAM band source aperture photometry flux (3 FWHM diameter) on PSF-matched images',
 'flux_g_ext_jpcam_4fwhm_aper': 'Gext JPCAM band source aperture photometry flux (4 FWHM diameter) on PSF-matched images',
 'flux_i_ext_panstarrs_1fwhm_aper': 'Iext PS band source aperture photometry flux (1 FWHM diameter) on PSF-matched images',
 'flux_i_ext_panstarrs_2fwhm_aper': 'Iext PS band source aperture photometry flux (2 FWHM diameter) on PSF-matched images',
 'flux_i_ext_panstarrs_3fwhm_aper': 'Iext PS band source aperture photometry flux (3 FWHM diameter) on PSF-matched images',
 'flux_i_ext_panstarrs_4fwhm_aper': 'Iext PS band source aperture photometry flux (4 FWHM diameter) on PSF-matched images',
 'flux_z_ext_panstarrs_1fwhm_aper': 'Zext PS band source aperture photometry flux (1 FWHM diameter) on PSF-matched images',
 'flux_z_ext_panstarrs_2fwhm_aper': 'Zext PS band source aperture photometry flux (2 FWHM diameter) on PSF-matched images',
 'flux_z_ext_panstarrs_3fwhm_aper': 'Zext PS band source aperture photometry flux (3 FWHM diameter) on PSF-matched images',
 'flux_z_ext_panstarrs_4fwhm_aper': 'Zext PS band source aperture photometry flux (4 FWHM diameter) on PSF-matched images',
 'flux_g_ext_hsc_1fwhm_aper': 'Gext HSC band source aperture photometry flux (1 FWHM diameter) on PSF-matched images',
 'flux_g_ext_hsc_2fwhm_aper': 'Gext HSC band source aperture photometry flux (2 FWHM diameter) on PSF-matched images',
 'flux_g_ext_hsc_3fwhm_aper': 'Gext HSC band source aperture photometry flux (3 FWHM diameter) on PSF-matched images',
 'flux_g_ext_hsc_4fwhm_aper': 'Gext HSC band source aperture photometry flux (4 FWHM diameter) on PSF-matched images',
 'flux_z_ext_hsc_1fwhm_aper': 'Zext HSC band source aperture photometry flux (1 FWHM diameter) on PSF-matched images',
 'flux_z_ext_hsc_2fwhm_aper': 'Zext HSC band source aperture photometry flux (2 FWHM diameter) on PSF-matched images',
 'flux_z_ext_hsc_3fwhm_aper': 'Zext HSC band source aperture photometry flux (3 FWHM diameter) on PSF-matched images',
 'flux_z_ext_hsc_4fwhm_aper': 'Zext HSC band source aperture photometry flux (4 FWHM diameter) on PSF-matched images',
 'fluxerr_vis_1fwhm_aper': 'VIS band source aperture photometry flux (1 FWHM diameter) on PSF-matched images error',
 'fluxerr_vis_2fwhm_aper': 'VIS band source aperture photometry flux (2 FWHM diameter) on PSF-matched images error',
 'fluxerr_vis_3fwhm_aper': 'VIS band source aperture photometry flux (3 FWHM diameter) on PSF-matched images error',
 'fluxerr_vis_4fwhm_aper': 'VIS band source aperture photometry flux (4 FWHM diameter) on PSF-matched images error',
 'fluxerr_y_1fwhm_aper': 'NIR Y band source aperture photometry flux (1 FWHM diameter) on PSF-matched images error',
 'fluxerr_y_2fwhm_aper': 'NIR Y band source aperture photometry flux (2 FWHM diameter) on PSF-matched images error',
 'fluxerr_y_3fwhm_aper': 'NIR Y band source aperture photometry flux (3 FWHM diameter) on PSF-matched images error',
 'fluxerr_y_4fwhm_aper': 'NIR Y band source aperture photometry flux (4 FWHM diameter) on PSF-matched images error',
 'fluxerr_j_1fwhm_aper': 'NIR J band source aperture photometry flux (1 FWHM diameter) on PSF-matched images error',
 'fluxerr_j_2fwhm_aper': 'NIR J band source aperture photometry flux (2 FWHM diameter) on PSF-matched images error',
 'fluxerr_j_3fwhm_aper': 'NIR J band source aperture photometry flux (3 FWHM diameter) on PSF-matched images error',
 'fluxerr_j_4fwhm_aper': 'NIR J band source aperture photometry flux (4 FWHM diameter) on PSF-matched images error',
 'fluxerr_h_1fwhm_aper': 'NIR H band source aperture photometry flux (1 FWHM diameter) on PSF-matched images error',
 'fluxerr_h_2fwhm_aper': 'NIR H band source aperture photometry flux (2 FWHM diameter) on PSF-matched images error',
 'fluxerr_h_3fwhm_aper': 'NIR H band source aperture photometry flux (3 FWHM diameter) on PSF-matched images error',
 'fluxerr_h_4fwhm_aper': 'NIR H band source aperture photometry flux (4 FWHM diameter) on PSF-matched images error',
 'fluxerr_nir_stack_1fwhm_aper': 'NIR stack band source aperture photometry flux (1 FWHM diameter) on PSF-matched images error',
 'fluxerr_nir_stack_2fwhm_aper': 'NIR stack band source aperture photometry flux (2 FWHM diameter) on PSF-matched images error',
 'fluxerr_nir_stack_3fwhm_aper': 'NIR stack band source aperture photometry flux (3 FWHM diameter) on PSF-matched images error',
 'fluxerr_nir_stack_4fwhm_aper': 'NIR stack band source aperture photometry flux (4 FWHM diameter) on PSF-matched images error',
 'fluxerr_u_ext_decam_1fwhm_aper': 'Uext DECam band source aperture photometry flux (1 FWHM diameter) on PSF-matched images error',
 'fluxerr_u_ext_decam_2fwhm_aper': 'Uext DECam band source aperture photometry flux (2 FWHM diameter) on PSF-matched images error',
 'fluxerr_u_ext_decam_3fwhm_aper': 'Uext DECam band source aperture photometry flux (3 FWHM diameter) on PSF-matched images error',
 'fluxerr_u_ext_decam_4fwhm_aper': 'Uext DECam band source aperture photometry flux (4 FWHM diameter) on PSF-matched images error',
 'fluxerr_g_ext_decam_1fwhm_aper': 'Gext DECam band source aperture photometry flux (1 FWHM diameter) on PSF-matched images error',
 'fluxerr_g_ext_decam_2fwhm_aper': 'Gext DECam band source aperture photometry flux (2 FWHM diameter) on PSF-matched images error',
 'fluxerr_g_ext_decam_3fwhm_aper': 'Gext DECam band source aperture photometry flux (3 FWHM diameter) on PSF-matched images error',
 'fluxerr_g_ext_decam_4fwhm_aper': 'Gext DECam band source aperture photometry flux (4 FWHM diameter) on PSF-matched images error',
 'fluxerr_r_ext_decam_1fwhm_aper': 'Rext DECam band source aperture photometry flux (1 FWHM diameter) on PSF-matched images error',
 'fluxerr_r_ext_decam_2fwhm_aper': 'Rext DECam band source aperture photometry flux (2 FWHM diameter) on PSF-matched images error',
 'fluxerr_r_ext_decam_3fwhm_aper': 'Rext DECam band source aperture photometry flux (3 FWHM diameter) on PSF-matched images error',
 'fluxerr_r_ext_decam_4fwhm_aper': 'Rext DECam band source aperture photometry flux (4 FWHM diameter) on PSF-matched images error',
 'fluxerr_i_ext_decam_1fwhm_aper': 'Iext DECam band source aperture photometry flux (1 FWHM diameter) on PSF-matched images error',
 'fluxerr_i_ext_decam_2fwhm_aper': 'Iext DECam band source aperture photometry flux (2 FWHM diameter) on PSF-matched images error',
 'fluxerr_i_ext_decam_3fwhm_aper': 'Iext DECam band source aperture photometry flux (3 FWHM diameter) on PSF-matched images error',
 'fluxerr_i_ext_decam_4fwhm_aper': 'Iext DECam band source aperture photometry flux (4 FWHM diameter) on PSF-matched images error',
 'fluxerr_z_ext_decam_1fwhm_aper': 'Zext DECam band source aperture photometry flux (1 FWHM diameter) on PSF-matched images error',
 'fluxerr_z_ext_decam_2fwhm_aper': 'Zext DECam band source aperture photometry flux (2 FWHM diameter) on PSF-matched images error',
 'fluxerr_z_ext_decam_3fwhm_aper': 'Zext DECam band source aperture photometry flux (3 FWHM diameter) on PSF-matched images error',
 'fluxerr_z_ext_decam_4fwhm_aper': 'Zext DECam band source aperture photometry flux (4 FWHM diameter) on PSF-matched images error',
 'fluxerr_u_ext_lsst_1fwhm_aper': 'Uext LSST band source aperture photometry flux (1 FWHM diameter) on PSF-matched images error',
 'fluxerr_u_ext_lsst_2fwhm_aper': 'Uext LSST band source aperture photometry flux (2 FWHM diameter) on PSF-matched images error',
 'fluxerr_u_ext_lsst_3fwhm_aper': 'Uext LSST band source aperture photometry flux (3 FWHM diameter) on PSF-matched images error',
 'fluxerr_u_ext_lsst_4fwhm_aper': 'Uext LSST band source aperture photometry flux (4 FWHM diameter) on PSF-matched images error',
 'fluxerr_g_ext_lsst_1fwhm_aper': 'Gext LSST band source aperture photometry flux (1 FWHM diameter) on PSF-matched images error',
 'fluxerr_g_ext_lsst_2fwhm_aper': 'Gext LSST band source aperture photometry flux (2 FWHM diameter) on PSF-matched images error',
 'fluxerr_g_ext_lsst_3fwhm_aper': 'Gext LSST band source aperture photometry flux (3 FWHM diameter) on PSF-matched images error',
 'fluxerr_g_ext_lsst_4fwhm_aper': 'Gext LSST band source aperture photometry flux (4 FWHM diameter) on PSF-matched images error',
 'fluxerr_r_ext_lsst_1fwhm_aper': 'Rext LSST band source aperture photometry flux (1 FWHM diameter) on PSF-matched images error',
 'fluxerr_r_ext_lsst_2fwhm_aper': 'Rext LSST band source aperture photometry flux (2 FWHM diameter) on PSF-matched images error',
 'fluxerr_r_ext_lsst_3fwhm_aper': 'Rext LSST band source aperture photometry flux (3 FWHM diameter) on PSF-matched images error',
 'fluxerr_r_ext_lsst_4fwhm_aper': 'Rext LSST band source aperture photometry flux (4 FWHM diameter) on PSF-matched images error',
 'fluxerr_i_ext_lsst_1fwhm_aper': 'Iext LSST band source aperture photometry flux (1 FWHM diameter) on PSF-matched images error',
 'fluxerr_i_ext_lsst_2fwhm_aper': 'Iext LSST band source aperture photometry flux (2 FWHM diameter) on PSF-matched images error',
 'fluxerr_i_ext_lsst_3fwhm_aper': 'Iext LSST band source aperture photometry flux (3 FWHM diameter) on PSF-matched images error',
 'fluxerr_i_ext_lsst_4fwhm_aper': 'Iext LSST band source aperture photometry flux (4 FWHM diameter) on PSF-matched images error',
 'fluxerr_z_ext_lsst_1fwhm_aper': 'Zext LSST band source aperture photometry flux (1 FWHM diameter) on PSF-matched images error',
 'fluxerr_z_ext_lsst_2fwhm_aper': 'Zext LSST band source aperture photometry flux (2 FWHM diameter) on PSF-matched images error',
 'fluxerr_z_ext_lsst_3fwhm_aper': 'Zext LSST band source aperture photometry flux (3 FWHM diameter) on PSF-matched images error',
 'fluxerr_z_ext_lsst_4fwhm_aper': 'Zext LSST band source aperture photometry flux (4 FWHM diameter) on PSF-matched images error',
 'fluxerr_u_ext_megacam_1fwhm_aper': 'Uext Megacam band source aperture photometry flux (1 FWHM diameter) on PSF-matched images error',
 'fluxerr_u_ext_megacam_2fwhm_aper': 'Uext Megacam band source aperture photometry flux (2 FWHM diameter) on PSF-matched images error',
 'fluxerr_u_ext_megacam_3fwhm_aper': 'Uext Megacam band source aperture photometry flux (3 FWHM diameter) on PSF-matched images error',
 'fluxerr_u_ext_megacam_4fwhm_aper': 'Uext Megacam band source aperture photometry flux (4 FWHM diameter) on PSF-matched images error',
 'fluxerr_r_ext_megacam_1fwhm_aper': 'Rext Megacam band source aperture photometry flux (1 FWHM diameter) on PSF-matched images error',
 'fluxerr_r_ext_megacam_2fwhm_aper': 'Rext Megacam band source aperture photometry flux (2 FWHM diameter) on PSF-matched images error',
 'fluxerr_r_ext_megacam_3fwhm_aper': 'Rext Megacam band source aperture photometry flux (3 FWHM diameter) on PSF-matched images error',
 'fluxerr_r_ext_megacam_4fwhm_aper': 'Rext Megacam band source aperture photometry flux (4 FWHM diameter) on PSF-matched images error',
 'fluxerr_g_ext_jpcam_1fwhm_aper': 'Gext JPCAM band source aperture photometry flux (1 FWHM diameter) on PSF-matched images error',
 'fluxerr_g_ext_jpcam_2fwhm_aper': 'Gext JPCAM band source aperture photometry flux (2 FWHM diameter) on PSF-matched images error',
 'fluxerr_g_ext_jpcam_3fwhm_aper': 'Gext JPCAM band source aperture photometry flux (3 FWHM diameter) on PSF-matched images error',
 'fluxerr_g_ext_jpcam_4fwhm_aper': 'Gext JPCAM band source aperture photometry flux (4 FWHM diameter) on PSF-matched images error',
 'fluxerr_i_ext_panstarrs_1fwhm_aper': 'Iext PS band source aperture photometry flux (1 FWHM diameter) on PSF-matched images error',
 'fluxerr_i_ext_panstarrs_2fwhm_aper': 'Iext PS band source aperture photometry flux (2 FWHM diameter) on PSF-matched images error',
 'fluxerr_i_ext_panstarrs_3fwhm_aper': 'Iext PS band source aperture photometry flux (3 FWHM diameter) on PSF-matched images error',
 'fluxerr_i_ext_panstarrs_4fwhm_aper': 'Iext PS band source aperture photometry flux (4 FWHM diameter) on PSF-matched images error',
 'fluxerr_z_ext_panstarrs_1fwhm_aper': 'Zext PS band source aperture photometry flux (1 FWHM diameter) on PSF-matched images error',
 'fluxerr_z_ext_panstarrs_2fwhm_aper': 'Zext PS band source aperture photometry flux (2 FWHM diameter) on PSF-matched images error',
 'fluxerr_z_ext_panstarrs_3fwhm_aper': 'Zext PS band source aperture photometry flux (3 FWHM diameter) on PSF-matched images error',
 'fluxerr_z_ext_panstarrs_4fwhm_aper': 'Zext PS band source aperture photometry flux (4 FWHM diameter) on PSF-matched images error',
 'fluxerr_g_ext_hsc_1fwhm_aper': 'Gext HSC band source aperture photometry flux (1 FWHM diameter) on PSF-matched images error',
 'fluxerr_g_ext_hsc_2fwhm_aper': 'Gext HSC band source aperture photometry flux (2 FWHM diameter) on PSF-matched images error',
 'fluxerr_g_ext_hsc_3fwhm_aper': 'Gext HSC band source aperture photometry flux (3 FWHM diameter) on PSF-matched images error',
 'fluxerr_g_ext_hsc_4fwhm_aper': 'Gext HSC band source aperture photometry flux (4 FWHM diameter) on PSF-matched images error',
 'fluxerr_z_ext_hsc_1fwhm_aper': 'Zext HSC band source aperture photometry flux (1 FWHM diameter) on PSF-matched images error',
 'fluxerr_z_ext_hsc_2fwhm_aper': 'Zext HSC band source aperture photometry flux (2 FWHM diameter) on PSF-matched images error',
 'fluxerr_z_ext_hsc_3fwhm_aper': 'Zext HSC band source aperture photometry flux (3 FWHM diameter) on PSF-matched images error',
 'fluxerr_z_ext_hsc_4fwhm_aper': 'Zext HSC band source aperture photometry flux (4 FWHM diameter) on PSF-matched images error',
 'flux_y_templfit': 'NIR Y band source template fitting flux (TPHOT measurement)',
 'flux_j_templfit': 'NIR J band source template fitting flux (TPHOT measurement)',
 'flux_h_templfit': 'NIR H band source template fitting flux (TPHOT measurement)',
 'flux_u_ext_decam_templfit': 'Uext DECam band source template fitting flux (TPHOT measurement)',
 'flux_g_ext_decam_templfit': 'Gext DECam band source template fitting flux (TPHOT measurement)',
 'flux_r_ext_decam_templfit': 'Rext DECam band source template fitting flux (TPHOT measurement)',
 'flux_i_ext_decam_templfit': 'Iext DECam band source template fitting flux (TPHOT measurement)',
 'flux_z_ext_decam_templfit': 'Zext DECam band source template fitting flux (TPHOT measurement)',
 'flux_u_ext_lsst_templfit': 'Uext LSST band source template fitting flux (TPHOT measurement)',
 'flux_g_ext_lsst_templfit': 'Gext LSST band source template fitting flux (TPHOT measurement)',
 'flux_r_ext_lsst_templfit': 'Rext LSST band source template fitting flux (TPHOT measurement)',
 'flux_i_ext_lsst_templfit': 'Iext LSST band source template fitting flux (TPHOT measurement)',
 'flux_z_ext_lsst_templfit': 'Zext LSST band source template fitting flux (TPHOT measurement)',
 'flux_u_ext_megacam_templfit': 'Uext Megacam band source template fitting flux (TPHOT measurement)',
 'flux_r_ext_megacam_templfit': 'Rext Megacam band source template fitting flux (TPHOT measurement)',
 'flux_g_ext_jpcam_templfit': 'Gext JPCAM band source template fitting flux (TPHOT measurement)',
 'flux_i_ext_panstarrs_templfit': 'Iext PS band source template fitting flux (TPHOT measurement)',
 'flux_z_ext_panstarrs_templfit': 'Zext PS band source template fitting flux (TPHOT measurement)',
 'flux_g_ext_hsc_templfit': 'Gext HSC band source template fitting flux (TPHOT measurement)',
 'flux_z_ext_hsc_templfit': 'Zext HSC band source template fitting flux (TPHOT measurement)',
 'fluxerr_y_templfit': 'NIR Y band source template fitting flux error (TPHOT measurement)',
 'fluxerr_j_templfit': 'NIR J band source template fitting flux error (TPHOT measurement)',
 'fluxerr_h_templfit': 'NIR H band source template fitting flux error (TPHOT measurement)',
 'fluxerr_u_ext_decam_templfit': 'Uext DECam band source template fitting flux error (TPHOT measurement)',
 'fluxerr_g_ext_decam_templfit': 'Gext DECam band source template fitting flux error (TPHOT measurement)',
 'fluxerr_r_ext_decam_templfit': 'Rext DECam band source template fitting flux error (TPHOT measurement)',
 'fluxerr_i_ext_decam_templfit': 'Iext DECam band source template fitting flux error (TPHOT measurement)',
 'fluxerr_z_ext_decam_templfit': 'Zext DECam band source template fitting flux error (TPHOT measurement)',
 'fluxerr_u_ext_lsst_templfit': 'Uext LSST band source template fitting flux error (TPHOT measurement)',
 'fluxerr_g_ext_lsst_templfit': 'Gext LSST band source template fitting flux error (TPHOT measurement)',
 'fluxerr_r_ext_lsst_templfit': 'Rext LSST band source template fitting flux error (TPHOT measurement)',
 'fluxerr_i_ext_lsst_templfit': 'Iext LSST band source template fitting flux error (TPHOT measurement)',
 'fluxerr_z_ext_lsst_templfit': 'Zext LSST band source template fitting flux error (TPHOT measurement)',
 'fluxerr_u_ext_megacam_templfit': 'Uext Megacam band source template fitting flux error (TPHOT measurement)',
 'fluxerr_r_ext_megacam_templfit': 'Rext Megacam band source template fitting flux error (TPHOT measurement)',
 'fluxerr_g_ext_jpcam_templfit': 'Gext JPCAM band source template fitting flux error (TPHOT measurement)',
 'fluxerr_i_ext_panstarrs_templfit': 'Iext PS band source template fitting flux error (TPHOT measurement)',
 'fluxerr_z_ext_panstarrs_templfit': 'Zext PS band source template fitting flux error (TPHOT measurement)',
 'fluxerr_g_ext_hsc_templfit': 'Gext HSC band source template fitting flux error (TPHOT measurement)',
 'fluxerr_z_ext_hsc_templfit': 'Zext HSC band source template fitting flux error (TPHOT measurement)',
 'flux_vis_to_y_templfit': 'VIS band source flux on a VIS image PSF-matched to NIR Y band (TPHOT measurement)',
 'flux_vis_to_j_templfit': 'VIS band source flux on a VIS image PSF-matched to NIR J band (TPHOT measurement)',
 'flux_vis_to_h_templfit': 'VIS band source flux on a VIS image PSF-matched to NIR H band (TPHOT measurement)',
 'flux_vis_to_u_ext_decam_templfit': 'VIS band source flux on a VIS image PSF-matched to Uext DECam band (TPHOT measurement)',
 'flux_vis_to_g_ext_decam_templfit': 'VIS band source flux on a VIS image PSF-matched to Gext DECam band (TPHOT measurement)',
 'flux_vis_to_r_ext_decam_templfit': 'VIS band source flux on a VIS image PSF-matched to Rext DECam band (TPHOT measurement)',
 'flux_vis_to_i_ext_decam_templfit': 'VIS band source flux on a VIS image PSF-matched to Iext DECam band (TPHOT measurement)',
 'flux_vis_to_z_ext_decam_templfit': 'VIS band source flux on a VIS image PSF-matched to Zext DECam band (TPHOT measurement)',
 'flux_vis_to_u_ext_lsst_templfit': 'VIS band source flux on a VIS image PSF-matched to Uext LSST band (TPHOT measurement)',
 'flux_vis_to_g_ext_lsst_templfit': 'VIS band source flux on a VIS image PSF-matched to Gext LSST band (TPHOT measurement)',
 'flux_vis_to_r_ext_lsst_templfit': 'VIS band source flux on a VIS image PSF-matched to Rext LSST band (TPHOT measurement)',
 'flux_vis_to_i_ext_lsst_templfit': 'VIS band source flux on a VIS image PSF-matched to Iext LSST band (TPHOT measurement)',
 'flux_vis_to_z_ext_lsst_templfit': 'VIS band source flux on a VIS image PSF-matched to Zext LSST band (TPHOT measurement)',
 'flux_vis_to_u_ext_megacam_templfit': 'VIS band source flux on a VIS image PSF-matched to Uext Megacam band (TPHOT measurement)',
 'flux_vis_to_r_ext_megacam_templfit': 'VIS band source flux on a VIS image PSF-matched to Rext Megacam band (TPHOT measurement)',
 'flux_vis_to_g_ext_jpcam_templfit': 'VIS band source flux on a VIS image PSF-matched to Gext JPCAM band (TPHOT measurement)',
 'flux_vis_to_i_ext_panstarrs_templfit': 'VIS band source flux on a VIS image PSF-matched to Iext PS band (TPHOT measurement)',
 'flux_vis_to_z_ext_panstarrs_templfit': 'VIS band source flux on a VIS image PSF-matched to Zext PS band (TPHOT measurement)',
 'flux_vis_to_g_ext_hsc_templfit': 'VIS band source flux on a VIS image PSF-matched to Gext HSC band (TPHOT measurement)',
 'flux_vis_to_z_ext_hsc_templfit': 'VIS band source flux on a VIS image PSF-matched to Zext HSC band (TPHOT measurement)',
 'fluxerr_vis_to_y_templfit': 'VIS band source flux error on a VIS image PSF-matched to NIR Y band (TPHOT measurement)',
 'fluxerr_vis_to_j_templfit': 'VIS band source flux error on a VIS image PSF-matched to NIR J bandr (TPHOT measurement)',
 'fluxerr_vis_to_h_templfit': 'VIS band source flux error on a VIS image PSF-matched to NIR H band (TPHOT measurement)',
 'fluxerr_vis_to_u_ext_decam_templfit': 'VIS band source flux error on a VIS image PSF-matched to Uext DECam band (TPHOT measurement)',
 'fluxerr_vis_to_g_ext_decam_templfit': 'VIS band source flux error on a VIS image PSF-matched to Gext DECam band (TPHOT measurement)',
 'fluxerr_vis_to_r_ext_decam_templfit': 'VIS band source flux error on a VIS image PSF-matched to Rext DECam band (TPHOT measurement)',
 'fluxerr_vis_to_i_ext_decam_templfit': 'VIS band source flux error on a VIS image PSF-matched to Iext DECam band (TPHOT measurement)',
 'fluxerr_vis_to_z_ext_decam_templfit': 'VIS band source flux error on a VIS image PSF-matched to Zext DECam band (TPHOT measurement)',
 'fluxerr_vis_to_u_ext_lsst_templfit': 'VIS band source flux error on a VIS image PSF-matched to Uext LSST band (TPHOT measurement)',
 'fluxerr_vis_to_g_ext_lsst_templfit': 'VIS band source flux error on a VIS image PSF-matched to Gext LSST band (TPHOT measurement)',
 'fluxerr_vis_to_r_ext_lsst_templfit': 'VIS band source flux error on a VIS image PSF-matched to Rext LSST band (TPHOT measurement)',
 'fluxerr_vis_to_i_ext_lsst_templfit': 'VIS band source flux error on a VIS image PSF-matched to Iext LSST band (TPHOT measurement)',
 'fluxerr_vis_to_z_ext_lsst_templfit': 'VIS band source flux error on a VIS image PSF-matched to Zext LSST band (TPHOT measurement)',
 'fluxerr_vis_to_u_ext_megacam_templfit': 'VIS band source flux error on a VIS image PSF-matched to Uext Megacam band (TPHOT measurement)',
 'fluxerr_vis_to_r_ext_megacam_templfit': 'VIS band source flux error on a VIS image PSF-matched to Rext Megacam band (TPHOT measurement)',
 'fluxerr_vis_to_g_ext_jpcam_templfit': 'VIS band source flux error on a VIS image PSF-matched to Gext JPCAM band (TPHOT measurement)',
 'fluxerr_vis_to_i_ext_panstarrs_templfit': 'VIS band source flux error on a VIS image PSF-matched to Iext PS band (TPHOT measurement)',
 'fluxerr_vis_to_z_ext_panstarrs_templfit': 'VIS band source flux error on a VIS image PSF-matched to Zext PS band (TPHOT measurement)',
 'fluxerr_vis_to_g_ext_hsc_templfit': 'VIS band source flux error on a VIS image PSF-matched to Gext HSC band (TPHOT measurement)',
 'fluxerr_vis_to_z_ext_hsc_templfit': 'VIS band source flux error on a VIS image PSF-matched to Zext HSC band (TPHOT measurement)',
 'flux_vis_psf': 'VIS band source PSF-fitting photometry flux (TPHOT measurement)',
 'fluxerr_vis_psf': 'VIS band source PSF-fitting photometry flux error (TPHOT measurement)',
 'flux_segmentation': 'VIS or NIR stack band source segmented area flux',
 'fluxerr_segmentation': 'VIS or NIR stack band source total flux (Kron aperture)',
 'flux_detection_total': 'VIS or NIR stack band source total flux error (Kron aperture)',
 'fluxerr_detection_total': 'VIS or NIR stack band source segmented area flux',
 'flux_vis_sersic': 'VIS band source flux from the Sersic fit',
 'flux_y_sersic': 'NIR Y band source flux from the Sersic fit',
 'flux_j_sersic': 'NIR J band source flux from the Sersic fit',
 'flux_h_sersic': 'NIR H band source flux from the Sersic fit',
 'flux_u_ext_decam_sersic': 'Uext DECam band source flux from the Sersic fit',
 'flux_g_ext_decam_sersic': 'Gext DECam band source flux from the Sersic fit',
 'flux_r_ext_decam_sersic': 'Rext DECam band source flux from the Sersic fit',
 'flux_i_ext_decam_sersic': 'Iext DECam band source flux from the Sersic fit',
 'flux_z_ext_decam_sersic': 'Zext DECam band source flux from the Sersic fit',
 'flux_u_ext_lsst_sersic': 'Uext LSST band source flux from the Sersic fit',
 'flux_g_ext_lsst_sersic': 'Gext LSST band source flux from the Sersic fit',
 'flux_r_ext_lsst_sersic': 'Rext LSST band source flux from the Sersic fit',
 'flux_i_ext_lsst_sersic': 'Iext LSST band source flux from the Sersic fit',
 'flux_z_ext_lsst_sersic': 'Zext LSST band source flux from the Sersic fit',
 'flux_u_ext_megacam_sersic': 'Uext Megacam band source flux from the Sersic fit',
 'flux_r_ext_megacam_sersic': 'Rext Megacam band source flux from the Sersic fit',
 'flux_g_ext_jpcam_sersic': 'Gext JPCAM band source flux from the Sersic fit',
 'flux_i_ext_panstarrs_sersic': 'Iext PS band source flux from the Sersic fit',
 'flux_z_ext_panstarrs_sersic': 'Zext PS band source flux from the Sersic fit',
 'flux_g_ext_hsc_sersic': 'Gext HSC band source flux from the Sersic fit',
 'flux_z_ext_hsc_sersic': 'Zext HSC band source flux from the Sersic fit',
 'fluxerr_vis_sersic': 'VIS band source flux error from the Sersic fit',
 'fluxerr_y_sersic': 'NIR Y band source flux error from the Sersic fit',
 'fluxerr_j_sersic': 'NIR J band source flux error from the Sersic fit',
 'fluxerr_h_sersic': 'NIR H band source flux error from the Sersic fit',
 'fluxerr_u_ext_decam_sersic': 'Uext DECam band source flux error from the Sersic fit',
 'fluxerr_g_ext_decam_sersic': 'Gext DECam band source flux error from the Sersic fit',
 'fluxerr_r_ext_decam_sersic': 'Rext DECam band source flux error from the Sersic fit',
 'fluxerr_i_ext_decam_sersic': 'Iext DECam band source flux error from the Sersic fit',
 'fluxerr_z_ext_decam_sersic': 'Zext DECam band source flux error from the Sersic fit',
 'fluxerr_u_ext_lsst_sersic': 'Uext LSST band source flux error from the Sersic fit',
 'fluxerr_g_ext_lsst_sersic': 'Gext LSST band source flux error from the Sersic fit',
 'fluxerr_r_ext_lsst_sersic': 'Rext LSST band source flux error from the Sersic fit',
 'fluxerr_i_ext_lsst_sersic': 'Iext LSST band source flux error from the Sersic fit',
 'fluxerr_z_ext_lsst_sersic': 'Zext LSST band source flux error from the Sersic fit',
 'fluxerr_u_ext_megacam_sersic': 'Uext Megacam band source flux error from the Sersic fit',
 'fluxerr_r_ext_megacam_sersic': 'Rext Megacam band source flux error from the Sersic fit',
 'fluxerr_g_ext_jpcam_sersic': 'Gext JPCAM band source flux error from the Sersic fit',
 'fluxerr_i_ext_panstarrs_sersic': 'Iext PS band source flux error from the Sersic fit',
 'fluxerr_z_ext_panstarrs_sersic': 'Zext PS band source flux error from the Sersic fit',
 'fluxerr_g_ext_hsc_sersic': 'Gext HSC band source flux error from the Sersic fit',
 'fluxerr_z_ext_hsc_sersic': 'Zext HSC band source flux error from the Sersic fit',
 'flux_vis_disk_sersic': 'VIS band source flux from the Disk+Sersic fit',
 'flux_y_disk_sersic': 'NIR Y band source flux from the Disk+Sersic fit',
 'flux_j_disk_sersic': 'NIR J band source flux from the Disk+Sersic fit',
 'flux_h_disk_sersic': 'NIR H band source flux from the Disk+Sersic fit',
 'flux_u_ext_decam_disk_sersic': 'Uext DECam band source flux from the Disk+Sersic fit',
 'flux_g_ext_decam_disk_sersic': 'Gext DECam band source flux from the Disk+Sersic fit',
 'flux_r_ext_decam_disk_sersic': 'Rext DECam band source flux from the Disk+Sersic fit',
 'flux_i_ext_decam_disk_sersic': 'Iext DECam band source flux from the Disk+Sersic fit',
 'flux_z_ext_decam_disk_sersic': 'Zext DECam band source flux from the Disk+Sersic fit',
 'flux_u_ext_lsst_disk_sersic': 'Uext LSST band source flux from the Disk+Sersic fit',
 'flux_g_ext_lsst_disk_sersic': 'Gext LSST band source flux from the Disk+Sersic fit',
 'flux_r_ext_lsst_disk_sersic': 'Rext LSST band source flux from the Disk+Sersic fit',
 'flux_i_ext_lsst_disk_sersic': 'Iext LSST band source flux from the Disk+Sersic fit',
 'flux_z_ext_lsst_disk_sersic': 'Zext LSST band source flux from the Disk+Sersic fit',
 'flux_u_ext_megacam_disk_sersic': 'Uext Megacam band source flux from the Disk+Sersic fit',
 'flux_r_ext_megacam_disk_sersic': 'Rext Megacam band source flux from the Disk+Sersic fit',
 'flux_g_ext_jpcam_disk_sersic': 'Gext JPCAM band source flux from the Disk+Sersic fit',
 'flux_i_ext_panstarrs_disk_sersic': 'Iext PS band source flux from the Disk+Sersic fit',
 'flux_z_ext_panstarrs_disk_sersic': 'Zext PS band source flux from the Disk+Sersic fit',
 'flux_g_ext_hsc_disk_sersic': 'Gext HSC band source flux from the Disk+Sersic fit',
 'flux_z_ext_hsc_disk_sersic': 'Zext HSC band source flux from the Disk+Sersic fit',
 'fluxerr_vis_disk_sersic': 'VIS band source flux error from the Disk+Sersic fit',
 'fluxerr_y_disk_sersic': 'NIR Y band source flux error from the Disk+Sersic fit',
 'fluxerr_j_disk_sersic': 'NIR J band source flux error from the Disk+Sersic fit',
 'fluxerr_h_disk_sersic': 'NIR H band source flux error from the Disk+Sersic fit',
 'fluxerr_u_ext_decam_disk_sersic': 'Uext DECam band source flux error from the Disk+Sersic fit',
 'fluxerr_g_ext_decam_disk_sersic': 'Gext DECam band source flux error from the Disk+Sersic fit',
 'fluxerr_r_ext_decam_disk_sersic': 'Rext DECam band source flux error from the Disk+Sersic fit',
 'fluxerr_i_ext_decam_disk_sersic': 'Iext DECam band source flux error from the Disk+Sersic fit',
 'fluxerr_z_ext_decam_disk_sersic': 'Zext DECam band source flux error from the Disk+Sersic fit',
 'fluxerr_u_ext_lsst_disk_sersic': 'Uext LSST band source flux error from the Disk+Sersic fit',
 'fluxerr_g_ext_lsst_disk_sersic': 'Gext LSST band source flux error from the Disk+Sersic fit',
 'fluxerr_r_ext_lsst_disk_sersic': 'Rext LSST band source flux error from the Disk+Sersic fit',
 'fluxerr_i_ext_lsst_disk_sersic': 'Iext LSST band source flux error from the Disk+Sersic fit',
 'fluxerr_z_ext_lsst_disk_sersic': 'Zext LSST band source flux error from the Disk+Sersic fit',
 'fluxerr_u_ext_megacam_disk_sersic': 'Uext Megacam band source flux error from the Disk+Sersic fit',
 'fluxerr_r_ext_megacam_disk_sersic': 'Rext Megacam band source flux error from the Disk+Sersic fit',
 'fluxerr_g_ext_jpcam_disk_sersic': 'Gext JPCAM band source flux error from the Disk+Sersic fit',
 'fluxerr_i_ext_panstarrs_disk_sersic': 'Iext PS band source flux error from the Disk+Sersic fit',
 'fluxerr_z_ext_panstarrs_disk_sersic': 'Zext PS band source flux error from the Disk+Sersic fit',
 'fluxerr_g_ext_hsc_disk_sersic': 'Gext HSC band source flux error from the Disk+Sersic fit',
 'fluxerr_z_ext_hsc_disk_sersic': 'Zext HSC band source flux error from the Disk+Sersic fit',
 'sersic_fract_vis_disk_sersic': 'VIS band Sersic fraction',
 'sersic_fract_y_disk_sersic': 'NIR Y band Sersic fraction',
 'sersic_fract_j_disk_sersic': 'NIR J band Sersic fraction',
 'sersic_fract_h_disk_sersic': 'NIR H band Sersic fraction',
 'sersic_fract_u_ext_decam_disk_sersic': 'Uext DECam band Sersic fraction',
 'sersic_fract_g_ext_decam_disk_sersic': 'Gext DECam band Sersic fraction',
 'sersic_fract_r_ext_decam_disk_sersic': 'Rext DECam band Sersic fraction',
 'sersic_fract_i_ext_decam_disk_sersic': 'Iext DECam band Sersic fraction',
 'sersic_fract_z_ext_decam_disk_sersic': 'Zext DECam band Sersic fraction',
 'sersic_fract_u_ext_lsst_disk_sersic': 'Uext LSST band Sersic fraction',
 'sersic_fract_g_ext_lsst_disk_sersic': 'Gext LSST band Sersic fraction',
 'sersic_fract_r_ext_lsst_disk_sersic': 'Rext LSST band Sersic fraction',
 'sersic_fract_i_ext_lsst_disk_sersic': 'Iext LSST band Sersic fraction',
 'sersic_fract_z_ext_lsst_disk_sersic': 'Zext LSST band Sersic fraction',
 'sersic_fract_u_ext_megacam_disk_sersic': 'Uext Megacam band Sersic fraction',
 'sersic_fract_r_ext_megacam_disk_sersic': 'Rext Megacam band Sersic fraction',
 'sersic_fract_g_ext_jpcam_disk_sersic': 'Gext JPCAM band Sersic fraction',
 'sersic_fract_i_ext_panstarrs_disk_sersic': 'Iext PS band Sersic fraction',
 'sersic_fract_z_ext_panstarrs_disk_sersic': 'Zext PS band Sersic fraction',
 'sersic_fract_g_ext_hsc_disk_sersic': 'Gext HSC band Sersic fraction',
 'sersic_fract_z_ext_hsc_disk_sersic': 'Zext HSC band Sersic fraction',
 'sersic_fract_vis_disk_sersic_err': 'VIS band Sersic fraction error',
 'sersic_fract_y_disk_sersic_err': 'NIR Y band Sersic fraction error',
 'sersic_fract_j_disk_sersic_err': 'NIR J band Sersic fraction error',
 'sersic_fract_h_disk_sersic_err': 'NIR H band Sersic fraction error',
 'sersic_fract_u_ext_decam_disk_sersic_err': 'Uext DECam band Sersic fraction error',
 'sersic_fract_g_ext_decam_disk_sersic_err': 'Gext DECam band Sersic fraction error',
 'sersic_fract_r_ext_decam_disk_sersic_err': 'Rext DECam band Sersic fraction error',
 'sersic_fract_i_ext_decam_disk_sersic_err': 'Iext DECam band Sersic fraction error',
 'sersic_fract_z_ext_decam_disk_sersic_err': 'Zext DECam band Sersic fraction error',
 'sersic_fract_u_ext_lsst_disk_sersic_err': 'Uext LSST band Sersic fraction error',
 'sersic_fract_g_ext_lsst_disk_sersic_err': 'Gext LSST band Sersic fraction error',
 'sersic_fract_r_ext_lsst_disk_sersic_err': 'Rext LSST band Sersic fraction error',
 'sersic_fract_i_ext_lsst_disk_sersic_err': 'Iext LSST band Sersic fraction error',
 'sersic_fract_z_ext_lsst_disk_sersic_err': 'Zext LSST band Sersic fraction error',
 'sersic_fract_u_ext_megacam_disk_sersic_err': 'Uext Megacam band Sersic fraction error',
 'sersic_fract_r_ext_megacam_disk_sersic_err': 'Rext Megacam band Sersic fraction error',
 'sersic_fract_g_ext_jpcam_disk_sersic_err': 'Gext JPCAM band Sersic fraction error',
 'sersic_fract_i_ext_panstarrs_disk_sersic_err': 'Iext PS band Sersic fraction error',
 'sersic_fract_z_ext_panstarrs_disk_sersic_err': 'Zext PS band Sersic fraction error',
 'sersic_fract_g_ext_hsc_disk_sersic_err': 'Gext HSC band Sersic fraction error',
 'sersic_fract_z_ext_hsc_disk_sersic_err': 'Zext HSC band Sersic fraction error',
 'flag_vis': 'Objects flag keeping track of the flagged pixels in the VIS flag image',
 'flag_y': 'Objects flag keeping track of the flagged pixels in the NIR Y flag image',
 'flag_j': 'Objects flag keeping track of the flagged pixels in the NIR J flag image',
 'flag_h': 'Objects flag keeping track of the flagged pixels in the NIR H flag image',
 'flag_nir_stack': 'Objects flag keeping track of the flagged pixels in the NIR stack flag image',
 'flag_u_ext_decam': 'Objects flag keeping track of the flagged pixels in the UextDECam flag image',
 'flag_g_ext_decam': 'Objects flag keeping track of the flagged pixels in the GextDECam flag image',
 'flag_r_ext_decam': 'Objects flag keeping track of the flagged pixels in the RextDECam flag image',
 'flag_i_ext_decam': 'Objects flag keeping track of the flagged pixels in the IextDECam flag image',
 'flag_z_ext_decam': 'Objects flag keeping track of the flagged pixels in the ZextDECam flag image',
 'flag_u_ext_lsst': 'Objects flag keeping track of the flagged pixels in the Uext LSST flag image',
 'flag_g_ext_lsst': 'Objects flag keeping track of the flagged pixels in the Gext LSST flag image',
 'flag_r_ext_lsst': 'Objects flag keeping track of the flagged pixels in the Rext LSST flag image',
 'flag_i_ext_lsst': 'Objects flag keeping track of the flagged pixels in the Iext LSST flag image',
 'flag_z_ext_lsst': 'Objects flag keeping track of the flagged pixels in the Zext LSST flag image',
 'flag_u_ext_megacam': 'Objects flag keeping track of the flagged pixels in the Uext Megacam flag image',
 'flag_r_ext_megacam': 'Objects flag keeping track of the flagged pixels in the Rext Megacam flag image',
 'flag_g_ext_jpcam': 'Objects flag keeping track of the flagged pixels in the Gext JPCAM flag image',
 'flag_i_ext_panstarrs': 'Objects flag keeping track of the flagged pixels in the Iext PS flag image',
 'flag_z_ext_panstarrs': 'Objects flag keeping track of the flagged pixels in the Zext PS flag image',
 'flag_g_ext_hsc': 'Objects flag keeping track of the flagged pixels in the Gext HSC flag image',
 'flag_z_ext_hsc': 'Objects flag keeping track of the flagged pixels in the Zext HSC flag image',
 'avg_trans_wave_vis': 'Average filter transmission curve wavelength for the VIS band',
 'avg_trans_wave_y': 'Average filter transmission curve wavelength for the NIR Y band',
 'avg_trans_wave_j': 'Average filter transmission curve wavelength for the NIR J band',
 'avg_trans_wave_h': 'Average filter transmission curve wavelength for the NIR H band',
 'avg_trans_wave_u_ext_decam': 'Average filter transmission curve wavelength for the DECam U band',
 'avg_trans_wave_g_ext_decam': 'Average filter transmission curve wavelength for the DECam G band',
 'avg_trans_wave_r_ext_decam': 'Average filter transmission curve wavelength for the DECam R band',
 'avg_trans_wave_i_ext_decam': 'Average filter transmission curve wavelength for the DECam I band',
 'avg_trans_wave_z_ext_decam': 'Average filter transmission curve wavelength for the DECam Z band',
 'avg_trans_wave_u_ext_lsst': 'Average filter transmission curve wavelength for the LSST U band',
 'avg_trans_wave_g_ext_lsst': 'Average filter transmission curve wavelength for the LSST G band',
 'avg_trans_wave_r_ext_lsst': 'Average filter transmission curve wavelength for the LSST R band',
 'avg_trans_wave_i_ext_lsst': 'Average filter transmission curve wavelength for the LSST I band',
 'avg_trans_wave_z_ext_lsst': 'Average filter transmission curve wavelength for the LSST Z band',
 'avg_trans_wave_u_ext_megacam': 'Average filter transmission curve wavelength for the Megacam U band',
 'avg_trans_wave_r_ext_megacam': 'Average filter transmission curve wavelength for the Megacam R band',
 'avg_trans_wave_g_ext_jpcam': 'Average filter transmission curve wavelength for the JPCAM G band',
 'avg_trans_wave_i_ext_panstarrs': 'Average filter transmission curve wavelength for the PS I band',
 'avg_trans_wave_z_ext_panstarrs': 'Average filter transmission curve wavelength for the PS Z band',
 'avg_trans_wave_g_ext_hsc': 'Average filter transmission curve wavelength for the HSC G band',
 'avg_trans_wave_z_ext_hsc': 'Average filter transmission curve wavelength for the HSC Z band',
 'deblended_flag': 'Flag marking if the object was originally blended with another one',
 'parent_id': 'ID of the parent sources of a deblended object',
 'parent_visnir': 'ID of the parent sources of a deblended object',
 'blended_prob': 'Probability that the source is blended with another source',
 'she_flag': 'Flags for objects SHE might want to remove (eg. bright stars)',
 'variable_flag': 'Object variability flag',
 'binary_flag': 'Flag for potentially binary stars',
 'point_like_flag': '"Point-like flag : flag set to 1 for VIS detections with (DET_QUALITY_FLAG==0) AND (POINT_LIKE_PROBA>threshold), otherwise set to NaN"',
 'point_like_prob': "Probability between 0 and 1 that the source is point-like (the estimation uses a 'star probability cub' defined in the MDB). Value is set to NaN for ...",
 'extended_flag': 'Extended source flag',
 'extended_prob': 'Probability between 0 and 1 that the source is extended',
 'spurious_flag': 'Spurious source flag',
 'spurious_prob': 'Probability between 0 and 1 that the source is spurious',
 'mag_stargal_sep': 'Magnitude used to compute POINT_LIKE_PROB',
 'det_quality_flag': 'Detection step flags that could indicate the possible corruption of the MAG_STARGAL_SEP values',
 'mu_max': 'Peak surface brightness above the background in the detection band (directly from SExtractor)',
 'mumax_minus_mag': '"The difference between MU_MAX and MAG_STARGAL_SEP, valid even for NIR-only sources"',
 'segmentation_area': 'Isophotal area of the source above the analysis threshold (SExtractor ISOAREA_IMAGE)',
 'semimajor_axis': 'Semi-major axis of the source (from Asterism)',
 'semimajor_axis_err': 'Semi-major axis error',
 'position_angle': 'Position angle (CCW/x) of the source (SExtractor THETA_IMAGE) range: -90 up to +90 decimal degrees',
 'position_angle_err': 'Position angle error',
 'ellipticity': '"A parametrization of how stretched an object is in the detection band, computed from the minor and major axes of the object itself (directly from SExt..."',
 'ellipticity_err': 'Ellipticity error',
 'kron_radius': 'Major semi-axis (in pixels) of the elliptical aperture used for total (Kron) aperture photometry on the detection image',
 'kron_radius_err': 'Error on the major semi-axis (in pixels) of the elliptical aperture used for total (Kron) aperture photometry on the detection image',
 'fwhm': '"FWHM (in arcsec) used in a-phot to compute colors. A-phot fluxes are computed within apertures that are multiples (1, 2, 3, 4 times) of this FWHM"',
 'gal_ebv': 'Estimated galactic E(B-V) at the source centroid according to the reference Planck map',
 'gal_ebv_err': 'Error on galactic E(B-V) according to the reference Planck map',
 'gaia_id': 'The associated GAIA source id',
 'gaia_match_quality': 'The quality of the GAIA match',
 'tileid': 'Euclid Tile ID',
 'x': 'Unit sphere (x,y,z) position x value',
 'y': 'Unit sphere (x,y,z) position y value',
 'z': 'Unit sphere (x,y,z) position z value',
 'spt_ind': 'Spatial (x,y,z) index key',
 'htm20': 'HTM spatial (x,y,z) index key',
 'cntr': '',
 'has_spectrum': 'Flag indicating whether a combined 1-d spectrum exists for this object (1 = spectrum exists)'}
Find some objects with spectra in our tileID#
We specify the following conditions on our search:
Signal to noise ratio column (_gf = gaussian fit) should be greater than 5
We want to detect H-alpha.
We choose in which tileID to search, usign the tileID from the first notebook.
Choose spectroscopic redshift (spe_z) beween 1.4 and 1.6 and spe_z_prob greater than 0.999
H-alpha line flux should be more than 2x10^16 erg s^-1 cm^-2
Join the lines and galaxy candidates tables on object_id and spe_rank
Finally we sort the data by descending spe_line_snr_gf to have the largest SNR H-alpha lines detected at the top.
adql_query = ("SELECT DISTINCT mer.object_id,mer.ra, mer.dec, mer.tileid, mer.flux_y_templfit, "
    "lines.spe_line_snr_gf,lines.spe_line_snr_di, lines.spe_line_name, lines.spe_line_central_wl_gf, "
    "lines.spe_line_ew_gf, galaxy.spe_z_err, galaxy.spe_z,galaxy.spe_z_prob, "
    "lines.spe_line_flux_gf, lines.spe_line_flux_err_gf "
    f"FROM {table_mer} AS mer "
    f"JOIN {table_lines} AS lines "
    "ON mer.object_id = lines.object_id "
    f"JOIN {table_galaxy_candidates} AS galaxy "
    "ON lines.object_id = galaxy.object_id AND lines.spe_rank = galaxy.spe_rank "
    "WHERE lines.spe_line_snr_gf >5 "
    "AND lines.spe_line_name = 'Halpha' "
    f"AND mer.tileid = {tileID} "
    "AND galaxy.spe_z_prob > 0.99 "
    "AND galaxy.spe_z BETWEEN 1.4 AND 1.6 "
    "AND lines.spe_line_flux_gf > 2E-16 "
    "ORDER BY lines.spe_line_snr_gf DESC ")

# Use TAP with this ADQL string
result_table = Irsa.query_tap(adql_query).to_table()
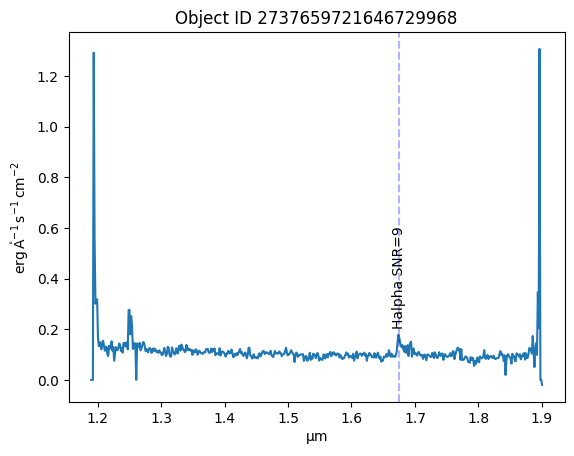
Choose an object of interest, lets look at an object with a strong Halpha line detected with high SNR.#
obj_id = 2737659721646729968

obj_row = result_table[(result_table['object_id'] == obj_id)]

obj_row
| object_id | ra | dec | tileid | flux_y_templfit | spe_line_snr_gf | spe_line_snr_di | spe_line_name | spe_line_central_wl_gf | spe_line_ew_gf | spe_z_err | spe_z | spe_z_prob | spe_line_flux_gf | spe_line_flux_err_gf |
|---|---|---|---|---|---|---|---|---|---|---|---|---|---|---|
| deg | deg | uJy | ||||||||||||
| int64 | float64 | float64 | int64 | float32 | float32 | float32 | object | float32 | float32 | float32 | float32 | float32 | float32 | float32 |
| 2737659721646729968 | 273.76597217 | 64.67299689 | 102158277 | 49.94940948 | 8.55331707 | 6.110000134 | Halpha | 16741.00195 | -24.14109612 | 0.0004555544874 | 1.553462625 | 0.9971491694 | 2.706930158e-16 | 6.770828671e-17 |
Pull the spectrum of this object#
adql_object = f"SELECT *  FROM {table_1dspectra}  WHERE objectid = {obj_id}"

result_table2 = Irsa.query_tap(adql_object).to_qtable()
The following steps to read in the spectrum follows the 3_Euclid_intro_1D_spectra notebook.#
This involves reading in the spectrum without readin in the full FITS file, just pulling the extension we want.
file_uri = urllib.parse.urljoin(Irsa.tap_url, result_table2['uri'][0])
file_uri
'https://irsa.ipac.caltech.edu/ibe/data/euclid/q1/SIR/102158277/EUC_SIR_W-COMBSPEC_102158277_2024-11-05T15:54:09.376202Z.fits'
with fits.open(file_uri) as hdul:
    spectrum = QTable.read(hdul[result_table2['hdu'][0]], format='fits')
    spec_header = hdul[result_table2['hdu'][0]].header
WARNING: UnitsWarning: 'Number' did not parse as fits unit: At col 0, Unit 'Number' not supported by the FITS standard.  If this is meant to be a custom unit, define it with 'u.def_unit'. To have it recognized inside a file reader or other code, enable it with 'u.add_enabled_units'. For details, see https://docs.astropy.org/en/latest/units/combining_and_defining.html [astropy.units.core]
WARNING: UnitsWarning: 'Number' did not parse as fits unit: At col 0, Unit 'Number' not supported by the FITS standard.  If this is meant to be a custom unit, define it with 'u.def_unit'. To have it recognized inside a file reader or other code, enable it with 'u.add_enabled_units'. For details, see https://docs.astropy.org/en/latest/units/combining_and_defining.html [astropy.units.core]
WARNING: UnitsWarning: 'Number' did not parse as fits unit: At col 0, Unit 'Number' not supported by the FITS standard.  If this is meant to be a custom unit, define it with 'u.def_unit'. To have it recognized inside a file reader or other code, enable it with 'u.add_enabled_units'. For details, see https://docs.astropy.org/en/latest/units/combining_and_defining.html [astropy.units.core]
Now the data are read in, plot the spectrum with the H-alpha line labeled#
Tip
As we use astropy.visualization’s quantity_support, matplotlib automatically picks up the axis units from the quantitites we plot.
quantity_support()
<astropy.visualization.units.quantity_support.<locals>.MplQuantityConverter at 0x7f8f7e467310>
# Note that the units are missing from the lines table, we manually add Angstrom
line_wavelengths = obj_row['spe_line_central_wl_gf'] * u.angstrom
line_names = obj_row['spe_line_name']
snr_gf = obj_row['spe_line_snr_gf']

plt.plot(spectrum['WAVELENGTH'].to(u.micron), spectrum['SIGNAL'])

for wl, name, snr in zip(np.atleast_1d(line_wavelengths), np.atleast_1d(line_names), np.atleast_1d(snr_gf)):
    plt.axvline(wl, color='b', linestyle='--', alpha=0.3)
    plt.text(wl, .2, name+' SNR='+str(round(snr)), rotation=90, ha='center', va='bottom', fontsize=10)

plt.title(f'Object ID {obj_id}')
Text(0.5, 1.0, 'Object ID 2737659721646729968')
About this Notebook#
Author: Tiffany Meshkat, Anahita Alavi, Anastasia Laity, Andreas Faisst, Brigitta Sipőcz, Dan Masters, Harry Teplitz, Jaladh Singhal, Shoubaneh Hemmati, Vandana Desai
Updated: 2025-03-31
Contact: the IRSA Helpdesk with questions or reporting problems.