Note
Go to the end to download the full example code.
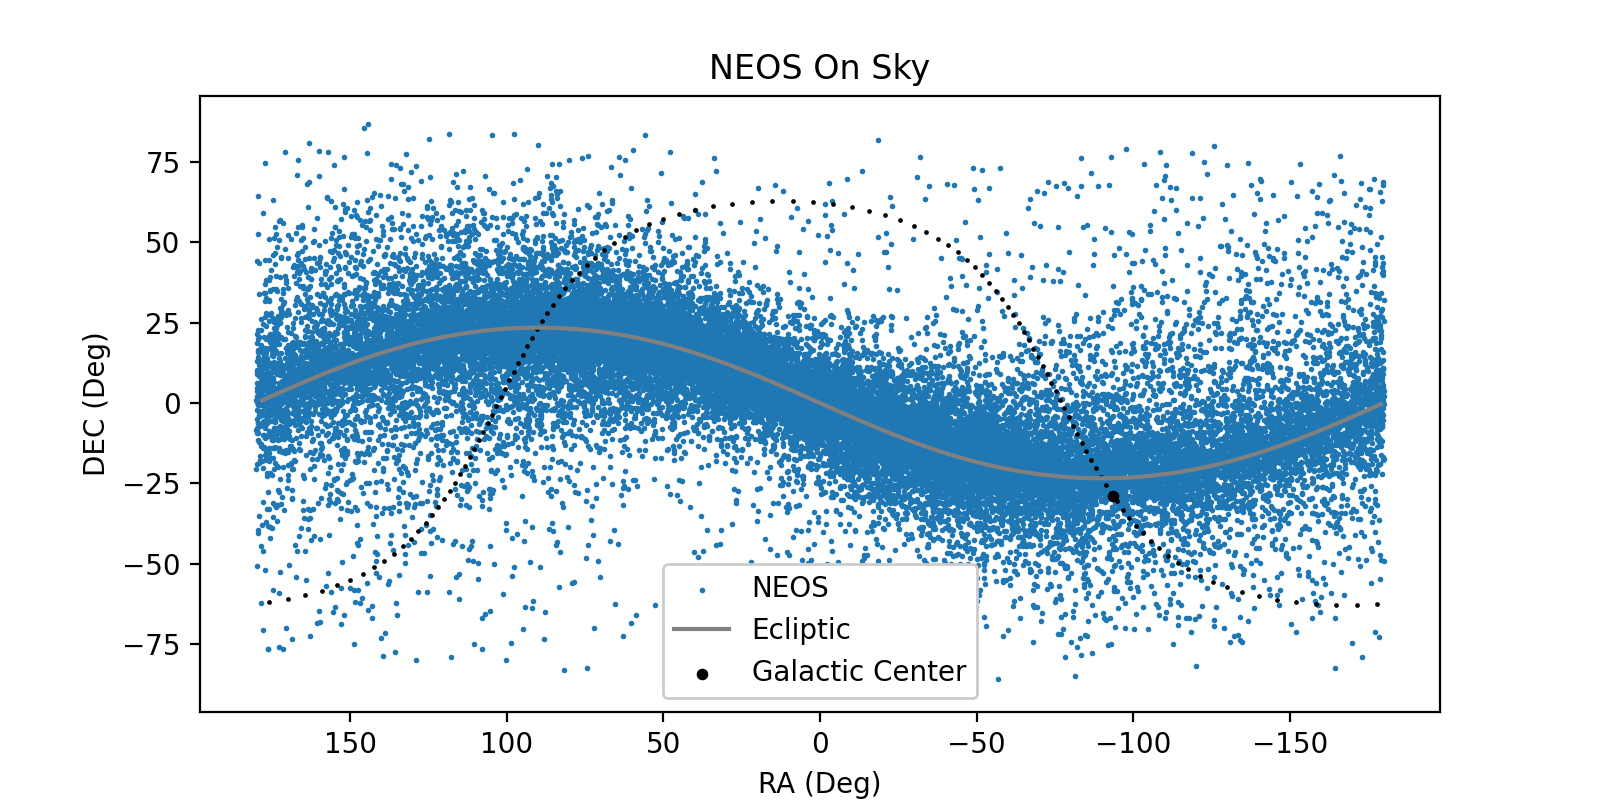
NEOS near the Galactic Center
Calculate the distance NEOs are from the galactic center over one month. Plot the on sky distribution of all NEOs along with the galactic and ecliptic planes.
import kete
import matplotlib.pyplot as plt
import numpy as np

jd_start = kete.Time.from_ymd(2025, 3, 1).jd
jd_end = kete.Time.from_ymd(2025, 4, 1).jd


# Load all orbits from the MPC catalog
all_orbits = kete.mpc.fetch_known_orbit_data()

# Filter to just the neos
neos = all_orbits[kete.population.neo(all_orbits.peri_dist, all_orbits.ecc)]

# convert the catalog to States
states = kete.mpc.table_to_states(neos)

# propagate the states to the start date, this may take several seconds.
# If this is NEOs, there will be several impacts of old small objects which hit
# the Earth over the years.
states = kete.propagate_n_body(states, jd_start)

galactic_center = kete.Vector.from_el_az(
    0, 0, 1, frame=kete.Frames.Galactic
).as_equatorial

dist_to_galactic_center = []
while states[0].jd < jd_end:
    states = kete.propagate_two_body(states, states[0].jd + 1)

    earth = kete.spice.get_state("Earth", states[0].jd)

    earth_to_obj = [(s.pos - earth.pos) for s in states]
    dist_to_galactic_center.append(
        [v.angle_between(galactic_center) for v in earth_to_obj]
    )

min_distance = np.min(dist_to_galactic_center, 0)

print(
    f"About {np.mean(min_distance < 10):0.2%} of NEOs get within 10 degrees of the "
    "Galactic center over 1 month"
)
About 4.78% of NEOs get within 10 degrees of the Galactic center over 1 month
Plot on sky position of all NEOs along with galactic and ecliptic planes
galactic_plane = []
ecliptic_plane = []
for angle in np.arange(181, 361 + 180, 3):
    vec = kete.Vector.from_el_az(0.0, angle, 1, kete.Frames.Galactic).as_equatorial
    galactic_plane.append([(vec.ra + 180) % 360 - 180, vec.dec])

    vec = kete.Vector.from_lat_lon(0, angle).as_equatorial
    ecliptic_plane.append([(vec.ra + 180) % 360 - 180, vec.dec])

ra_decs = [
    [(v.as_equatorial.ra + 180) % 360 - 180, v.as_equatorial.dec] for v in earth_to_obj
]

plt.figure(dpi=200, figsize=(8, 4))
plt.scatter(*np.transpose(ra_decs), s=1, label="NEOS")
plt.scatter(*np.transpose(galactic_plane), s=0.5, c="black")
plt.plot(*np.transpose(ecliptic_plane), c="Grey", label="Ecliptic")
plt.scatter(
    (galactic_center.ra + 180) % 360 - 180,
    galactic_center.dec,
    s=10,
    c="black",
    label="Galactic Center",
)
plt.gca().invert_xaxis()
plt.legend(framealpha=1)
plt.xlabel("RA (Deg)")
plt.ylabel("DEC (Deg)")
plt.title("NEOS On Sky")
plt.show()
Total running time of the script: (0 minutes 22.982 seconds)