Note
Go to the end to download the full example code.
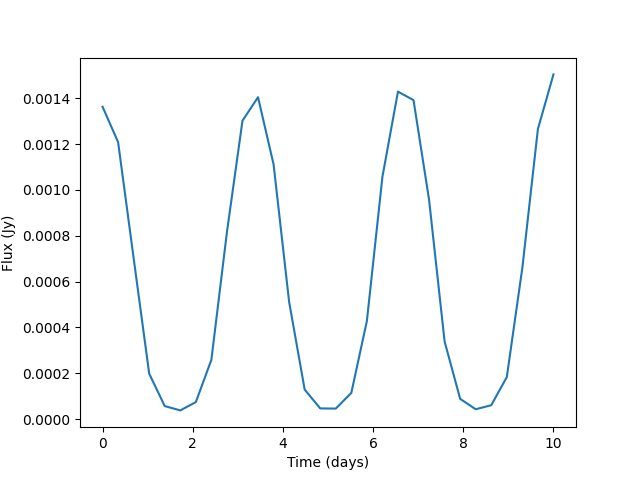
Plot a Light Curve
This is an example plot of a light curve using NEATM.
import kete
import numpy as np
import matplotlib.pyplot as plt


# Using ceres as a source for a state vector
state = kete.spice.get_state("ceres", 2460000.5)

# Various input values
albedo = 0.1
G = 0.15
diameter = 0.5
beaming = 1
wavelength = 22000
emissivity = 0.9

# Geometry and rotation information
# Rotation rate is in rotations per day
rotation_rate = 3.2
# sample 30 times over the course of 10 day, this will be highly nyquist limited.
dts = np.linspace(0, 10, 30)

# Construct an object which is twice the radius in they y axis.
geom = kete.shape.TriangleEllipsoid(30, x_scale=1, y_scale=2, z_scale=1)
normals = [kete.Vector(norm) for norm in geom.normals]

# Pick an axis of rotation
axis_of_rotation = kete.Vector.from_lat_lon(90, 0)

jd = state.jd
fluxes = []

for dt in dts:
    # Find the observer and object positions some time in the future.
    earth_pos = kete.spice.get_state("Earth", jd + dt).pos
    final_pos = kete.propagate_two_body([state], jd + dt, earth_pos)[0].pos

    obj2obs = final_pos - earth_pos

    # Rotate the normal vectors around the defined axis of rotation
    new_normals = np.array(
        [
            norm.rotate_around(axis_of_rotation, rotation_rate * dt * 360)
            for norm in normals
        ]
    )

    ss_temp = kete.flux.sub_solar_temperature(-obj2obs, albedo, G, emissivity, beaming)
    temps = kete.flux.neatm_facet_temps(new_normals, ss_temp, obj2obs)
    facet_fluxes = [kete.flux.black_body_flux(t, wavelength) for t in temps]
    facet_fluxes = np.array(facet_fluxes) * geom.areas
    flux = kete.flux.lambertian_flux(
        facet_fluxes, geom.normals, -obj2obs, diameter, emissivity
    )
    fluxes.append(flux)
plt.plot(dts, fluxes)
plt.xlabel("Time (days)")
plt.ylabel("Flux (Jy)")
plt.show()
Total running time of the script: (0 minutes 1.371 seconds)