Note
Go to the end to download the full example code.
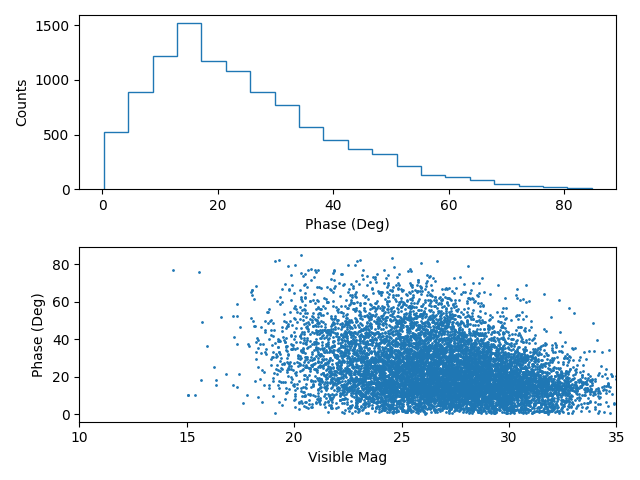
Plot visible phases and mags from the MPC
import kete
import numpy as np
import matplotlib.pyplot as plt


# Fetch known orbits from the MPC
orbits = kete.mpc.fetch_known_orbit_data()

# Subselect NEO population
neos = kete.population.neo(orbits.peri_dist, orbits.ecc)
neo_subset = orbits[neos]

# Convert the dataframe to States
neos = kete.mpc.table_to_states(neo_subset)

# Note that some of the objects will have NAN positions, which is result of
# them hitting the earth after discovery.

# Pick your favorite time to observe
jd = kete.Time.from_iso("2025-07-03T23:11:42.748000+00:00").jd

# Move the entire population of asteroids to that time using 2-body
# mechanics, this can be directly substituted with propagate_n_body if you
# want more precision.
sun2earth = kete.spice.get_state("Earth", jd).pos
states = kete.propagate_two_body(neos, jd)

# Compute the expected V-mags for these objects at this time
mags = []
phases = []
elongs = []
for i, state in enumerate(states):
    sun2obj = state.pos
    obj2earth = sun2earth - sun2obj
    mags.append(
        kete.flux.hg_apparent_mag(
            sun2obj=sun2obj,
            sun2obs=sun2earth,
            h_mag=neo_subset.h_mag.iloc[i],
            g_param=neo_subset.g_phase.iloc[i],
        )
    )

    # Do some vector math to get the phase angles.
    phases.append(obj2earth.angle_between(-sun2obj))
    elongs.append((-sun2earth).angle_between(-obj2earth))

mags = np.array(mags)
elongs = np.array(elongs)
phases = np.array(phases)


# Plot the results
plt.subplot(2, 1, 1)
plt.hist(phases[elongs > 90], histtype="step", bins=20)
plt.xlabel("Phase (Deg)")
plt.ylabel("Counts")

plt.subplot(2, 1, 2)
plt.scatter(mags[elongs > 90], phases[elongs > 90], s=1)
plt.xlim(10, 35)
plt.xlabel("Visible Mag")
plt.ylabel("Phase (Deg)")
plt.tight_layout()
plt.show()
Total running time of the script: (0 minutes 2.404 seconds)