Note
Go to the end to download the full example code.
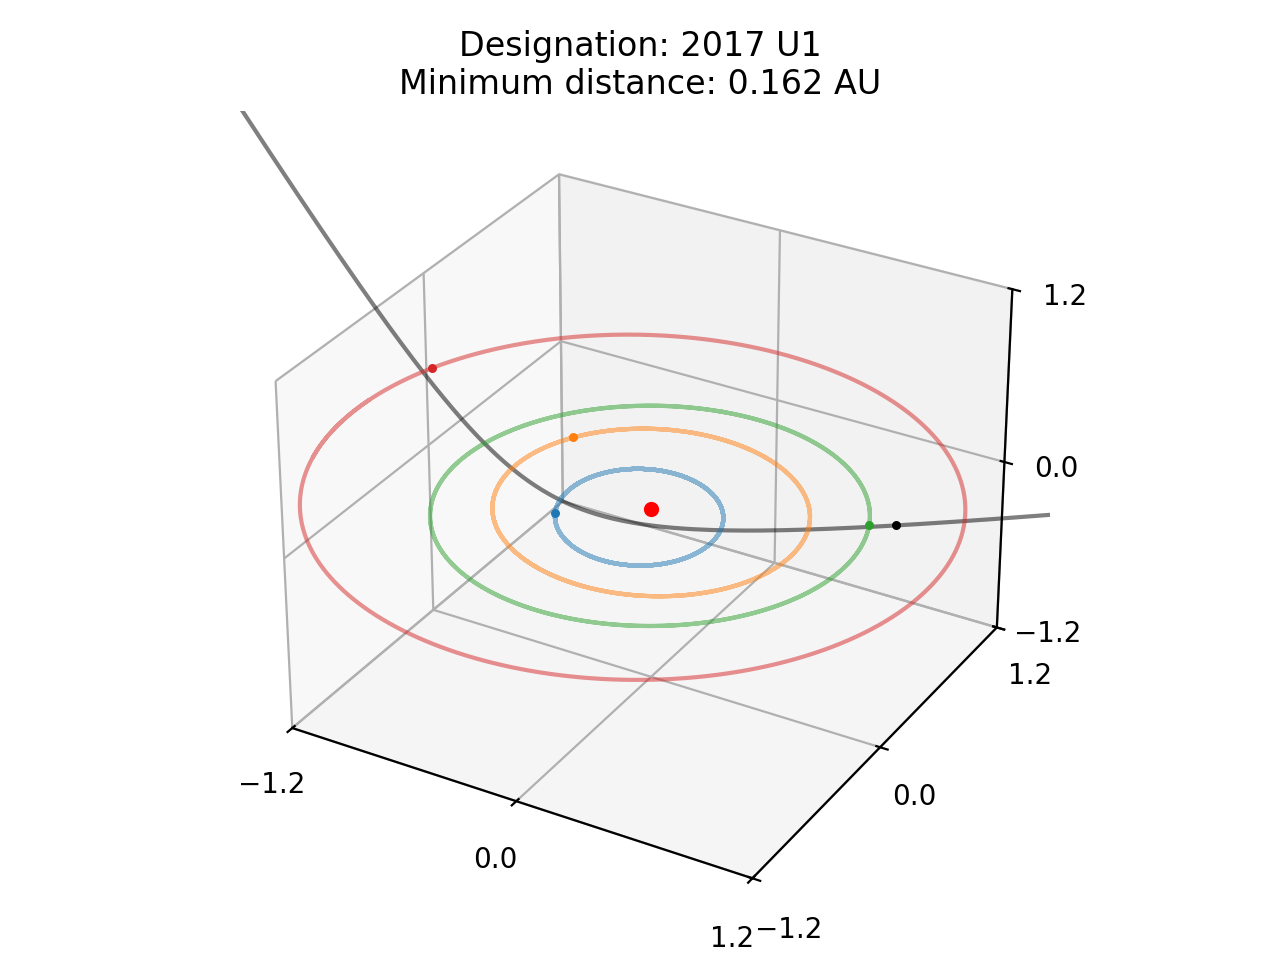
Plot the trajectory of ‘Oumuamua
This will open an interactive 3d plot of the solar system with the object plotted between the specified dates.
import kete
import matplotlib.pyplot as plt
import numpy as np
Inputs
Select the object of interest, and the times to plot the trajectory
obj = kete.HorizonsProperties.fetch("'Oumuamua")
jd_start = kete.Time.from_ymd(2016, 1, 1).jd
jd_end = kete.Time.from_ymd(2018, 1, 1).jd

# Select the scale of the X/Y/Z axis
zoom = 1.2
Plot
# Sample the time from start to end in 1 day steps
jds = np.arange(jd_start, jd_end)


# Propagate the object to all of the state
obj_pos = []
earth_pos = []
earth_r = []
last_state = obj.state
for jd in jds:
    last_state = kete.propagate_two_body([last_state], jd)[0]
    obj_pos.append(last_state.pos)
    earth_pos.append(kete.spice.get_state("Earth", jd).pos)
    earth_r.append(kete.Vector(obj_pos[-1] - earth_pos[-1]).r)

# Find the time where the closest encounter with the earth
jd_center = jds[np.argmin(earth_r)]

pos = np.array([s for s in obj_pos]).T
pos_center = obj_pos[np.argmin(earth_r)]

plt.figure(dpi=200)
ax = plt.gcf().add_subplot(projection="3d")
plt.title(
    "Designation: " + obj.desig + "\n" + f"Minimum distance: {min(earth_r):.3g} AU"
)
ax.plot(pos[0], pos[1], pos[2], alpha=0.5, color="black")
ax.scatter(pos_center.x, pos_center.y, pos_center.z, s=5, color="black")
for i, planet in enumerate(["Mercury", "Venus", "Earth", "Mars", "Jupiter"]):
    states = [kete.spice.get_state(planet, jd).pos for jd in jds]
    pos = np.array(states).T
    ax.plot(pos[0], pos[1], pos[2], color=f"C{i}", alpha=0.5)
    pos = kete.spice.get_state(planet, jd_center).pos
    ax.scatter(pos.x, pos.y, pos.z, color=f"C{i}", s=5)
ax.scatter(0, 0, 0, color="red")
ax.set_xticks([-zoom, 0, zoom])
ax.set_yticks([-zoom, 0, zoom])
ax.set_zticks([-zoom, 0, zoom])
ax.set_xlim(-zoom, zoom)
ax.set_ylim(-zoom, zoom)
ax.set_zlim(-zoom, zoom)
plt.tight_layout()
plt.show()

Total running time of the script: (0 minutes 0.183 seconds)