Note
Go to the end to download the full example code.
Plot the trajectory of Apophis
Plot the close approach of Apophis in 2029.
import kete
import matplotlib.pyplot as plt
import numpy as np
import matplotlib
# load apophis from horizons
cur_state = kete.HorizonsProperties.fetch("Apophis").state
jd_center = kete.Time.from_ymd(2029, 4, 13.9066).jd
jd_start = jd_center - 1.25
jd_end = jd_center + 1.25
steps = 1 / 24 / 20
# propagate the state up to the start date.
cur_state = kete.propagate_n_body([cur_state], jd_start, include_asteroids=True)[0]
# Now we propagate the object, recording info as we go
# this is not the most efficient way to do this, but for 1 object it is easy.
pos = []
dist_to_earth = []
moon_pos = []
dist_to_moon = []
elements = []
time = []
while cur_state.jd < jd_end:
# propagate the object, and include the massive main belt asteroids
cur_state = kete.propagate_n_body(
[cur_state], cur_state.jd + steps, include_asteroids=True
)[0]
time.append((cur_state.jd - jd_center))
elements.append(cur_state.elements)
rel_earth_state = cur_state.change_center(399)
pos.append([rel_earth_state.pos.x, rel_earth_state.pos.y])
# gets earths position and record the distances.
moon = kete.spice.get_state("Moon", cur_state.jd, center=399).pos
dist_to_moon.append((moon - rel_earth_state.pos).r * kete.constants.AU_KM)
dist_to_earth.append(rel_earth_state.pos.r * kete.constants.AU_KM)
moon_pos.append([moon.x, moon.y])
cmap = matplotlib.colormaps["magma"]
colors = [cmap(x / len(elements) * 0.8) for x in range(len(elements))]
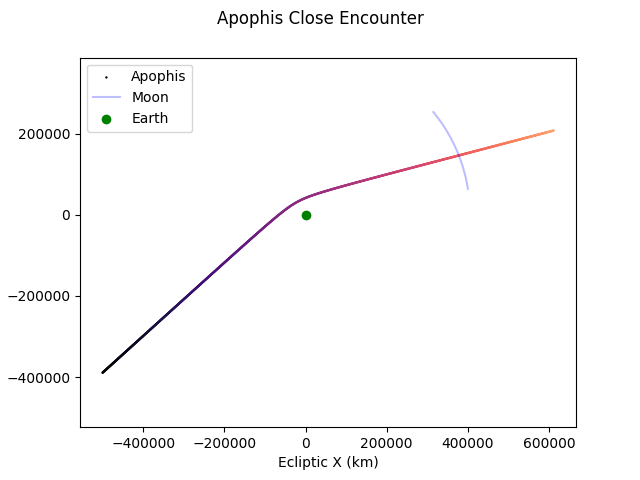
print("Closest approach is on:")
print(kete.Time(jd_start + np.argmin(dist_to_earth) * steps).ymd)
# Note that this is at 10 steps a day, so this is not an exact calculation
print(f"At a distance of about {np.min(dist_to_earth):0.0f} km")
Closest approach is on:
(2029, 4, 13.904516666661948)
At a distance of about 38011 km
Top down view of solar system:
plt.suptitle("Apophis Close Encounter")
plt.scatter(*np.transpose(pos) * kete.constants.AU_KM, s=0.5, label="Apophis", c=colors)
plt.plot(
    *np.transpose(moon_pos) * kete.constants.AU_KM, c="blue", alpha=0.25, label="Moon"
)
plt.gca().axis("equal")
plt.scatter(0, 0, c="Green", label="Earth")
plt.xlabel("Ecliptic X (km)")
plt.ylabel("Ecliptic Y (km)")
plt.legend(loc=2)
plt.show()
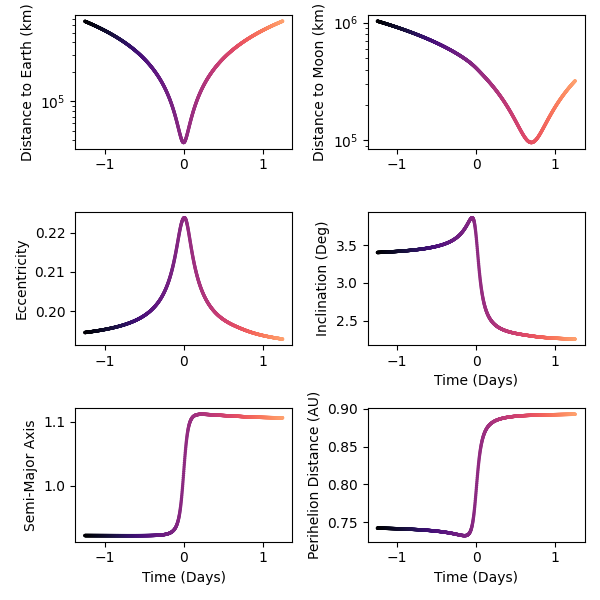
Orbital elements change:
plt.figure(figsize=(6, 6))
plt.subplot(321)
plt.scatter(time, dist_to_earth, c=colors, s=2)
plt.yscale("log")
plt.ylabel("Distance to Earth (km)")

plt.subplot(322)
plt.scatter(time, dist_to_moon, c=colors, s=2)
plt.yscale("log")
plt.ylabel("Distance to Moon (km)")

plt.subplot(323)
ecc = [e.eccentricity for e in elements]
plt.scatter(time, ecc, c=colors, s=2)
plt.ylabel("Eccentricity")

plt.subplot(324)
inc = [e.inclination for e in elements]
plt.scatter(time, inc, c=colors, s=2)
plt.ylabel("Inclination (Deg)")
plt.xlabel("Time (Days)")

plt.subplot(325)
a = [e.semi_major for e in elements]
plt.scatter(time, a, c=colors, s=2)
plt.ylabel("Semi-Major Axis")
plt.xlabel("Time (Days)")

plt.subplot(326)
a = [e.peri_dist for e in elements]
plt.scatter(time, a, c=colors, s=2)
plt.ylabel("Perihelion Distance (AU)")
plt.xlabel("Time (Days)")

plt.tight_layout()
plt.show()
Total running time of the script: (0 minutes 0.649 seconds)