Note
Go to the end to download the full example code.
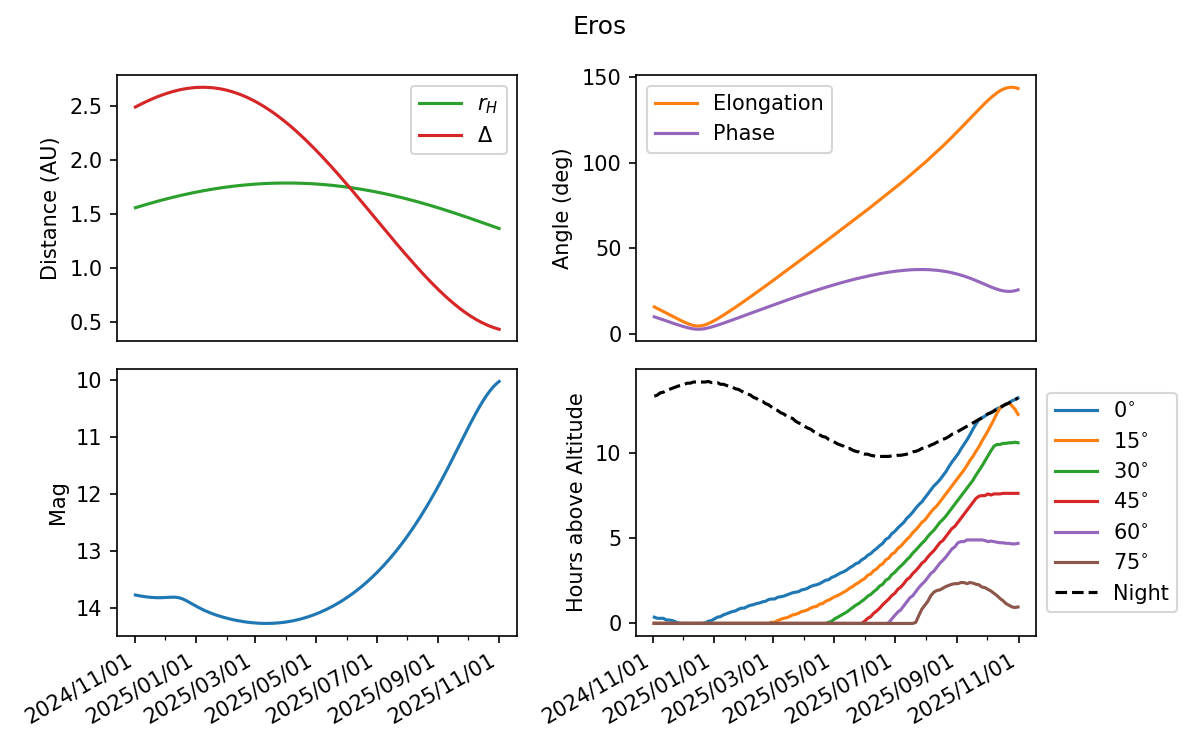
Plot observability of an object
Plot the observability of a given object from a position on the Earth.
- Given the following information:
Observers location on Earth in latitude/longitude.
Name of the object.
A start and stop date range.
This then plot various information about how observable the object is over the date range.
The first 3 plots are relatively self explanatory, the final of the plots is more complex. It plots the amount of time that the object is visible during the night. Specifically, it counts the total number of hours which the object is above the specified elevation. The dotted black line corresponds to the total length of the night as defined exactly sunset and sunrise at the observers location.
import matplotlib.pyplot as plt
import matplotlib.dates as mdates
import numpy as np
import kete

# Inputs:
# -------
obj = kete.HorizonsProperties.fetch("Eros", update_name=False)

start_time = kete.Time.from_ymd(2024, 11, 1).jd
end_time = kete.Time.from_ymd(2025, 11, 1).jd

# Observers position:
site = "Palomar Mountain"

# Plotting:
# ---------
n_steps = 1000
times = np.linspace(start_time, end_time, n_steps)

g_phase = 0.15 if obj.g_phase is None or np.isnan(obj.g_phase) else obj.g_phase
if obj.g_phase is None:
    print("Horizons doesn't contain a g parameter for this object, assuming 0.15!")
if obj.h_mag is None:
    print("Horizons doesn't have an h mag for this object, no mags will be computed!")

state = kete.propagate_n_body([obj.state], start_time)[0]

mags = []
solar_elon = []
phases = []
dist = []
sun_dist = []
for t in times:
    # For each time, compute the geometry, then compute the mag as well as all of the
    # various angle and distance values.
    state = kete.propagate_n_body([state], t)[0]
    sun2obs = kete.spice.mpc_code_to_ecliptic(site, t).pos
    earth2obs = kete.spice.mpc_code_to_ecliptic(site, t, center="399").pos

    sun2obj = state.pos
    obs2obj = -sun2obs + sun2obj

    # if we cannot compute mag, set the mag to NAN and keep moving
    if obj.h_mag is not None:
        mag = kete.flux.hg_apparent_mag(
            sun2obj=sun2obj, sun2obs=sun2obs, h_mag=obj.h_mag, g_param=g_phase
        )
        mag = np.clip(mag, -1000, 1000)
    else:
        mag = np.nan

    mags.append(mag)
    sun_dist.append(sun2obj.r)
    solar_elon.append((-sun2obs).angle_between(obs2obj))
    phases.append((-sun2obj).angle_between(-obs2obj))
    dist.append(obs2obj.r)

dates = [kete.Time(t).to_datetime() for t in times]
plt.figure(dpi=150, figsize=(8, 5))

plt.suptitle(f"{obj.desig}")

plt.subplot(221)

plt.plot(dates, sun_dist, c="C2", label=r"$r_H$")
plt.plot(dates, dist, c="C3", label=r"$\Delta$")
plt.ylabel("Distance (AU)")
plt.legend()
plt.xticks([])

plt.subplot(222)
plt.plot(dates, solar_elon, c="C1", label="Elongation")
plt.plot(dates, phases, c="C4", label="Phase")
plt.ylabel("Angle (deg)")
plt.legend()
plt.xticks([])


plt.subplot(223)

plt.plot(dates, mags)
plt.gca().invert_yaxis()
plt.ylabel("Mag")
plt.gca().xaxis.set_major_formatter(mdates.DateFormatter("%Y/%m/%d"))
plt.gcf().autofmt_xdate()
plt.gca().xaxis.set_major_locator(mdates.AutoDateLocator())
plt.gca().xaxis.set_minor_locator(mdates.MonthLocator())

plt.subplot(224)

# Final plot is more complicated, it requires looking at batched intervals of time that
# are at least 1 full day, preferably several days.
# During this interval, the average length of time the object is visible is computed
# during local night at the observers location.
step_size = 3
day_steps = np.arange(start_time, end_time, step_size)

# Substeps are done at 6 minute intervals
substeps = np.linspace(0, step_size, 24 * 10 * step_size)
substep_time = np.diff(substeps)[0]

elevations = []
night_len = []
for t in day_steps:
    elevation = []

    state = kete.propagate_n_body([state], t + substep_time / 2)[0]
    nights = []
    for subrange in substeps:
        approx_state = kete.propagate_two_body([state], t + subrange)[0]
        sun2obs = kete.spice.mpc_code_to_ecliptic(site, t + subrange).pos
        earth2obs = kete.spice.mpc_code_to_ecliptic(
            site, t + subrange, center="399"
        ).pos

        sun2obj = approx_state.pos
        obs2obj = sun2obj - sun2obs

        cur_alt = 90 - earth2obs.angle_between(obs2obj)
        night = earth2obs.angle_between(-sun2obs) > 90
        nights.append(night)
        if night:
            elevation.append(cur_alt)
    night_len.append(sum(nights) * substep_time)
    elevations.append(elevation)

dates = [kete.Time(t + step_size / 2).to_datetime() for t in day_steps]
for ang in [0, 15, 30, 45, 60, 75]:
    plt.plot(
        dates,
        [sum(np.array(a) > ang) * substep_time * 24 / step_size for a in elevations],
        label=f"{ang}" + r"$^{\circ}$",
    )

plt.plot(dates, np.array(night_len) * 24 / step_size, ls="--", c="k", label="Night")
plt.gca().legend(loc="center left", bbox_to_anchor=(1, 0.5))
plt.gca().xaxis.set_major_formatter(mdates.DateFormatter("%Y/%m/%d"))
plt.gca().xaxis.set_major_locator(mdates.AutoDateLocator())
plt.gca().xaxis.set_minor_locator(mdates.MonthLocator())
plt.gcf().autofmt_xdate()
plt.ylabel("Hours above Altitude")

plt.tight_layout()
plt.show()
Total running time of the script: (0 minutes 1.663 seconds)