Note
Go to the end to download the full example code.
Plot Elevation map of objects over a single night
Given an observer location, a date, and a list of objects, plot the maximum elevation that each object gets to over the course of the night, and when it happens.
from zoneinfo import ZoneInfo
from datetime import datetime, timedelta

import matplotlib.pyplot as plt
import matplotlib.dates as mdates
import numpy as np

from labellines import labelLines

import kete
Inputs:
timezone = ZoneInfo("America/Los_Angeles")

object_names = ["Vesta", "10p", "Pallas", 734]

start_time = datetime(2025, 2, 11, 12, tzinfo=timezone)

# Observers position, on the surface of the earth:
site = "Palomar Mountain"

# Elevation minimum label
cutoff = 20
Calculating elevations over one night
jd_start = kete.Time.from_iso(start_time.isoformat()).jd
jd_end = jd_start + 1

# Fetch orbital elements from horizons
states = [
    kete.HorizonsProperties.fetch(str(name), update_name=True).state
    for name in object_names
]
states = kete.propagate_n_body(states, jd_start)


# step through time in 1 minute increments
step_time = 1 / (24 * 60)
steps = np.arange(0, 1, step_time)

elevation = []
night_len = []
sun_elevation = []
moon_elevation = []
for subrange in steps:
    # for each time step, calculate the elevation and sun elevation
    jd_step = jd_start + subrange
    approx_state = kete.propagate_two_body(states, jd_step)
    sun2obs = kete.spice.mpc_code_to_ecliptic(site, jd_step).pos
    earth2obs = kete.spice.mpc_code_to_ecliptic(site, jd_step, center="399").pos
    sun_elevation.append(90 - earth2obs.angle_between(-sun2obs))

    moon = kete.spice.get_state("Moon", jd_step)
    obs2obj = kete.Vector(moon.pos - sun2obs)
    moon_elevation.append(90 - earth2obs.angle_between(obs2obj))

    cur_elev = []
    for state in approx_state:
        obs2obj = kete.Vector(state.pos - sun2obs)
        cur_elev.append(90 - earth2obs.angle_between(obs2obj))

    elevation.append(cur_elev)

elevation = np.array(elevation)
sun_elevation = np.array(sun_elevation)

# Keep only data points where the sun is below the horizon
# starting with sunset
sunset_idx = np.argmax(sun_elevation < 0)
elevation = elevation[sunset_idx:]
steps = steps[sunset_idx:]
sun_elevation = sun_elevation[sunset_idx:]
moon_elevation = moon_elevation[sunset_idx:]

# repeat for sunrise
sunrise_idx = np.argmax(sun_elevation > 0)
elevation = elevation[:sunrise_idx]
steps = steps[:sunrise_idx]
sun_elevation = sun_elevation[:sunrise_idx]
moon_elevation = moon_elevation[:sunrise_idx]

# Now sort the objects by earliest maximum elevation
sort_idx = np.argsort(np.argmax(np.array(elevation).T, axis=1))[::-1]
elevation = elevation[:, sort_idx]
object_names = np.array(object_names)[sort_idx]

dates_utc = [kete.Time(t + jd_start).to_datetime() for t in steps]
dates = [t.astimezone(timezone) for t in dates_utc]
moon_frac = kete.spice.moon_illumination_frac(jd_start)

# Find the time closest to midnight
midnight = dates[np.argmax([d.hour + d.minute for d in dates])]
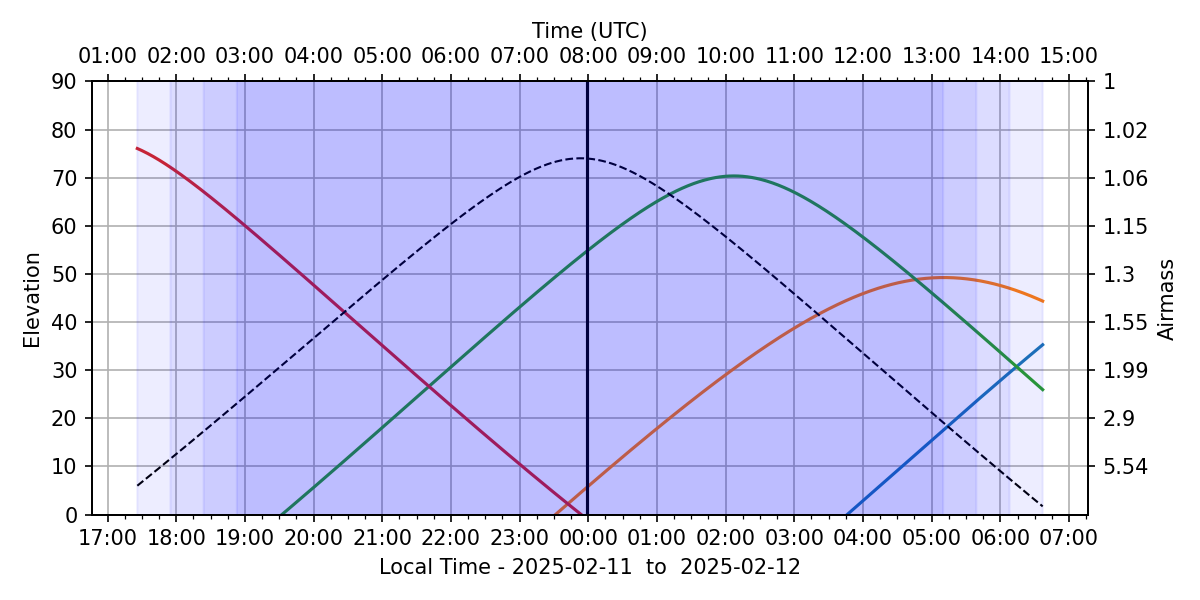
First Plot:
This shows the elevation of all objects as the night progresses.
plt.figure(dpi=150, figsize=(8, 4))

ys = np.arange(0, 91, 10)
plt.yticks(ys, ys)
plt.ylim(0, 90)

# plot each of the elevation lines
for elev, name in zip(elevation.T, object_names):
    plt.plot(dates, elev, label=name)

# Add labels at the top of the elevation lines
lines = plt.gca().get_lines()
max_elev = []
for idx, line in zip(np.argmax(np.array(elevation).T, axis=1), lines):
    max_elev.append(line._x[idx])
try:
    labelLines(lines, xvals=max_elev, zorder=2.5)
except Exception as e:
    print("Problem with plotting labels on the elevation plot", e)

line = plt.plot(
    dates, moon_elevation, label=f"Moon ({moon_frac:0.0%})", ls="--", c="k", lw=1
)[0]
try:
    labelLines(
        [line],
        xvals=line._x[np.argmax(moon_elevation)],
        zorder=2.45,
        fontsize=8,
    )
except Exception as e:
    print("Problem with plotting labels on the elevation plot", e)

plt.axvline(midnight, c="k", zorder=2)


plt.xlabel(
    "Local Time - "
    + start_time.strftime("%Y-%m-%d")
    + "  to  "
    + (start_time + timedelta(days=1)).strftime("%Y-%m-%d")
)

plt.gca().xaxis.set_major_formatter(mdates.DateFormatter("%H:%M", tz=timezone))
plt.gca().xaxis.set_major_locator(mdates.HourLocator(byhour=range(24)))
plt.gca().xaxis.set_minor_locator(mdates.MinuteLocator(byminute=range(0, 24 * 15, 15)))
plt.ylabel("Elevation")

night = np.array(dates)[sun_elevation < 0]
civil_night = np.array(dates)[sun_elevation < -6]
nautical_night = np.array(dates)[sun_elevation < -12]
astro_night = np.array(dates)[sun_elevation < -18]

for dark in [night, civil_night, nautical_night, astro_night]:
    plt.fill_between(
        dark,
        -90,
        90,
        where=dark,
        color="blue",
        alpha=0.07,
        transform=plt.gca().get_xaxis_transform(),
        zorder=3,
    )

plt.grid()
ax = plt.twiny()
for elev, name in zip(elevation.T, object_names):
    plt.plot(dates, elev, c="None")
ax.xaxis.set_major_formatter(mdates.DateFormatter("%H:%M", tz="UTC"))
ax.xaxis.set_major_locator(mdates.HourLocator(byhour=range(24)))
ax.xaxis.set_minor_locator(mdates.MinuteLocator(byminute=range(0, 24 * 15, 15)))

plt.xlabel("Time (UTC)")

ymin, ymax = plt.gca().get_ylim()
ax2 = plt.twinx()
ax2.set_ylim(ymin, ymax)
elev_ticks = np.arange(10, 91, 10)
airmass = [f"{x:0.3g}" for x in kete.conversion.compute_airmass(90 - elev_ticks)]

ax2.set_yticks(elev_ticks, airmass)
plt.ylabel("Airmass")

plt.tight_layout()
plt.show()
Problem with plotting labels on the elevation plot x label location is outside data range!
Problem with plotting labels on the elevation plot x label location is outside data range!
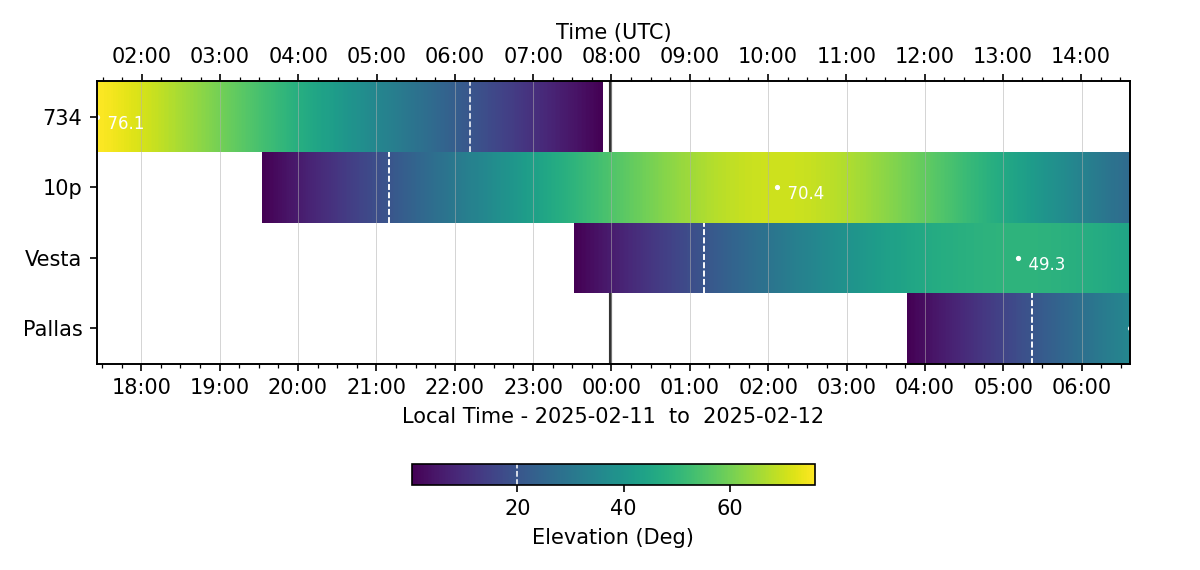
Second Plot:
Same data as above, but plotted as a heatmap, sorted by earliest maximum elevation.
elevation[elevation < 0] = np.nan
plt.figure(dpi=150, figsize=(8, 3 + len(object_names) * 0.2))
plt.xlabel(
    "Local Time - "
    + start_time.strftime("%Y-%m-%d")
    + "  to  "
    + (start_time + timedelta(days=1)).strftime("%Y-%m-%d")
)
plt.yticks(range(len(object_names)), object_names)
plt.xlim(np.min(night), np.max(night))
plt.axvline(midnight, c="k", alpha=0.8, zorder=-1)
plt.pcolormesh(dates, range(len(object_names)), np.clip(elevation.T, 0, 100))


x_cut = np.argmax(elevation > cutoff, axis=0)
for idx, idy in enumerate(x_cut):
    idy2 = np.argmax(elevation[(idy + 1) :, idx] < cutoff) + idy
    plt.plot(
        [dates[idy], dates[idy]], [idx - 0.5, idx + 0.5], c="white", ls="--", lw=0.75
    )
    plt.plot(
        [dates[idy2], dates[idy2]], [idx - 0.5, idx + 0.5], c="white", ls="--", lw=0.75
    )

for idx, idy in enumerate(np.argmax(np.nan_to_num(elevation), axis=0)):
    plt.plot(dates[idy], idx, ".", c="white", ms=3)
    plt.text(
        dates[idy],
        idx - 0.17,
        rf"  {elevation[idy, idx]:0.1f}",
        fontsize=8,
        color="white",
    )

plt.gca().xaxis.set_major_formatter(mdates.DateFormatter("%H:%M", tz=timezone))
plt.gca().xaxis.set_major_locator(mdates.HourLocator(byhour=range(24)))
plt.gca().xaxis.set_minor_locator(mdates.MinuteLocator(byminute=range(0, 24 * 15, 15)))


cb = plt.colorbar(location="bottom", pad=0.25, fraction=0.05, label="Elevation (Deg)")
cb.ax.plot([cutoff, cutoff], [0, 1], c="w", ls="--", lw=0.75)
plt.grid(axis="x", lw=0.25)

ax = plt.twiny()
ax.pcolormesh(dates, range(len(object_names)), np.clip(elevation.T, 0, 100), alpha=0)
ax.xaxis.set_major_formatter(mdates.DateFormatter("%H:%M", tz="UTC"))
ax.xaxis.set_major_locator(mdates.HourLocator(byhour=range(24)))
ax.xaxis.set_minor_locator(mdates.MinuteLocator(byminute=range(0, 24 * 15, 15)))
plt.xlabel("Time (UTC)")

plt.tight_layout()
plt.show()
Total running time of the script: (0 minutes 0.836 seconds)