Note
Go to the end to download the full example code.
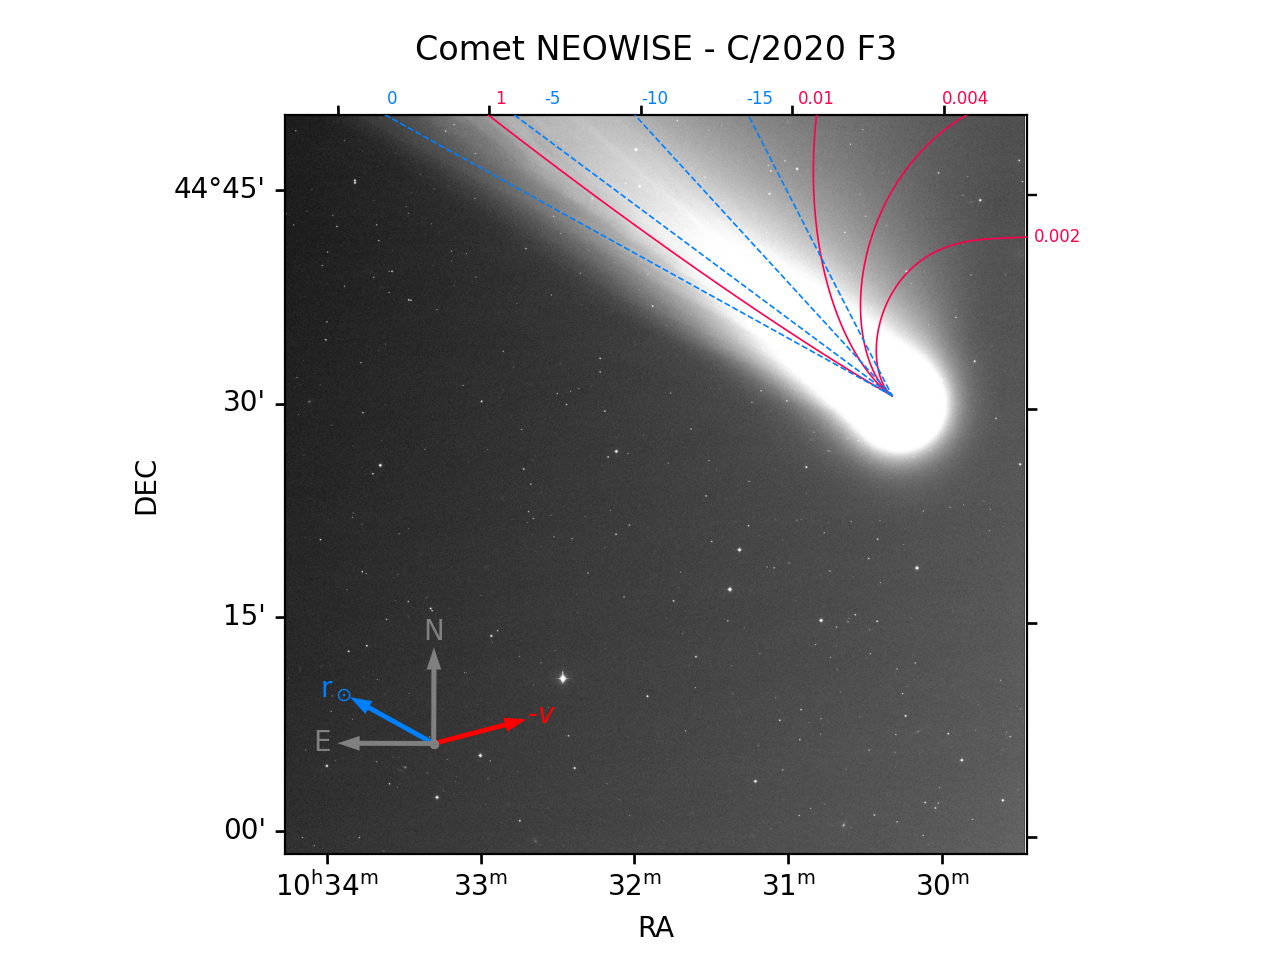
Annotated Comet
Given a specific FITs file containing a comet, annotate the plot with orbital information, such as diection of motion.
failure in B=0.040000 syndyne plotting, ERROR 8 in wcss2p() at line 3966 of file cextern/wcslib/C/wcs.c:
One or more of the pixel coordinates were invalid.
ERROR 6 in linx2p() at line 979 of file cextern/wcslib/C/lin.c:
De-distort error.
ERROR 5 in disx2p() at line 1411 of file cextern/wcslib/C/dis.c:
Convergence not achieved after 30 iterations, residual 4.0e-11.

failure in B=0.200000 syndyne plotting, ERROR 8 in wcss2p() at line 3966 of file cextern/wcslib/C/wcs.c:
One or more of the pixel coordinates were invalid.
ERROR 6 in linx2p() at line 979 of file cextern/wcslib/C/lin.c:
De-distort error.
ERROR 5 in disx2p() at line 1411 of file cextern/wcslib/C/dis.c:
Convergence not achieved after 30 iterations, residual     inf.

failure in -20 synchrone plotting ERROR 8 in wcss2p() at line 3966 of file cextern/wcslib/C/wcs.c:
One or more of the pixel coordinates were invalid.
ERROR 6 in linx2p() at line 979 of file cextern/wcslib/C/lin.c:
De-distort error.
ERROR 5 in disx2p() at line 1411 of file cextern/wcslib/C/dis.c:
Convergence not achieved after 30 iterations, residual 1.3e-10.

failure in -25 synchrone plotting ERROR 8 in wcss2p() at line 3966 of file cextern/wcslib/C/wcs.c:
One or more of the pixel coordinates were invalid.
ERROR 6 in linx2p() at line 979 of file cextern/wcslib/C/lin.c:
De-distort error.
ERROR 5 in disx2p() at line 1411 of file cextern/wcslib/C/dis.c:
Convergence not achieved after 30 iterations, residual     inf.
from astropy.wcs import WCS
import kete
import astropy
import numpy as np
import matplotlib.pyplot as plt


# This is comet NEOWISE as observed by ZTF
state = kete.HorizonsProperties.fetch("C/2020 F3").state

# Specific frame information for the ZTF frame where neowise was imaged.
# See the tutorials for KONA and Precovery for more information on how to
# find all the times an object is observed.
frame_info = dict(
    field=752,
    filefracday=20200723164595,
    ccdid=2,
    filtercode="zg",
    imgtypecode="o",
    qid=3,
)

# Load the fits file for this ZTF frame.
frame = astropy.io.fits.open(kete.ztf.fetch_ZTF_file(**frame_info))[0]

# Grab frame information from this file
jd = kete.Time(frame.header["OBSJD"], scaling="utc").jd
frame_wcs = WCS(frame.header, minerr=1e-8)

corners = []
dx, dy = frame_wcs.pixel_shape
for x, y in zip([dx, dx, 0, 0], [0, dy, dy, 0]):
    coord = frame_wcs.pixel_to_world(x, y).icrs
    corners.append(kete.Vector.from_ra_dec(coord.ra.deg, coord.dec.deg))
observer_loc = kete.spice.mpc_code_to_ecliptic("ZTF", jd)

# Build a kete FOV for this frame
fov = kete.ZtfCcdQuad(corners, observer_loc, maglimit=np.nan, fid=1, **frame_info)

# Compute the observation information for the comet in this frame
vis = kete.fov_state_check([state], [fov])[0]


def plot_vector(wcs, vec_a, vec_b, label, x=0.2, y=0.2, c="w", length=0.1, **kwargs):
    """
    Given a world coordinate system, and 2 positions, plot a projected vector from
    the vec_a toward vec_b in the given WCS. This is a fully generic plotting tool
    which is used immediately below to plot the relavent vectors.
    """
    vec_a = vec_a.as_equatorial
    vec_b = vec_b.as_equatorial
    pixels = wcs.world_to_pixel_values([vec_a.ra, vec_b.ra], [vec_a.dec, vec_b.dec])
    diff_dir = np.diff(pixels, axis=1).ravel()
    diff_dir /= np.linalg.norm(diff_dir)

    shape = wcs.array_shape
    length *= max(shape)
    x *= shape[0]
    y *= shape[1]

    kwargs["lw"] = kwargs.get("lw", 0.01)
    kwargs["width"] = kwargs.get("width", 20)
    plt.arrow(x, y, *diff_dir * length, color=c, **kwargs)
    plt.text(*(diff_dir * 1.5 * length + [x, y]), label, c=c, ha="center", va="center")
    plt.scatter(x, y, c="grey", s=5)


def plot_vectors(wcs, state, fov, x=0.2, y=0.2):
    """
    Plot 4 vectors using the WCS, the state of the object, and the FOV.

    The vectors plotted are:
    - Negative Velocity vector of the object, showing its motion.
    - Position vector, showing the direction away from the sun.
    - North vector, showing the Equatorial North.
    - East vector, showing Equatorial East.
    """

    past_vec = kete.propagate_n_body([state], state.jd - 0.05)[0].pos - fov.observer.pos
    sun_vec = (state.pos * 1.001) - fov.observer.pos
    vec = (state.pos - fov.observer.pos).as_equatorial
    north_vec = kete.Vector.from_ra_dec(vec.ra, vec.dec + 0.01)
    east_vec = kete.Vector.from_ra_dec(vec.ra + 0.01, vec.dec)

    plot_vector(wcs, vec, past_vec, r"-$v$", x=x, y=y, c="r")
    plot_vector(wcs, vec, sun_vec, r"r$_\odot$", x=x, y=y, c=(0, 0.5, 1))
    plot_vector(wcs, vec, north_vec, r"N", c="grey", x=x, y=y, ls="--", lw=0.1)
    plot_vector(wcs, vec, east_vec, r"E", c="grey", x=x, y=y, ls="--", lw=0.1)


def plot_syndyne(wcs, state, fov, beta, back_days=90, day_step=1, **kwargs):
    """
    Plot a single syndyne line for the provided beta value.
    """
    # create a non-grav model for the dust which will be used for propagation/
    model = kete.propagation.NonGravModel.new_dust(beta)

    # working backward, calculate the position of the comet at each time step
    dust_state = kete.propagate_n_body([state], fov.jd - back_days)[0]
    dust_states = []
    for jd in np.arange(dust_state.jd, fov.jd, day_step):
        dust_state = kete.propagate_n_body([dust_state], jd)[0]
        dust_states.append(dust_state)

    # Now treat all of those points as though they are release dust, and
    # propagated to the current epoch.
    cur_state = kete.propagate_n_body(
        dust_states, fov.jd, non_gravs=[model] * len(dust_states)
    )
    # apply a light delay correction
    cur_state = kete.propagate_two_body(cur_state, fov.jd, fov.observer.pos)

    # Setup plotting
    pos = [(x.pos - fov.observer.pos).as_equatorial for x in cur_state]
    ras = [x.ra for x in pos]
    decs = [x.dec for x in pos]
    shape = wcs.array_shape
    pix = []
    for x, y in zip(*wcs.world_to_pixel_values(ras, decs)):
        if not np.isfinite(x) or not np.isfinite(y):
            continue
        pix.append([x, y])
    plt.xlim(0, shape[0])
    plt.ylim(0, shape[1])
    plt.plot(*np.transpose(pix), **kwargs)


def plot_synchrone(
    wcs, state, fov, days_back, beta_max=1, beta_min=1e-5, beta_steps=100, **kwargs
):
    """
    Plot a single sychrone line for the provided release day.
    """
    # Sample beta values evenly in log space.
    betas = np.logspace(np.log10(beta_min), np.log10(beta_max), beta_steps)[::-1]

    # build non-grav models for each beta
    models = [kete.propagation.NonGravModel.new_dust(beta) for beta in betas]

    # propagate the comet back to the release date
    dust_state = kete.propagate_n_body([state], fov.jd + days_back)[0]
    dust_states = [dust_state] * len(betas)

    # release dust and propagate foward to the current epoch.
    cur_state = kete.propagate_n_body(dust_states, fov.jd, non_gravs=models)
    # apply a light delay correction
    cur_state = kete.propagate_two_body(cur_state, fov.jd, fov.observer.pos)

    # setup plotting
    pos = [(x.pos - fov.observer.pos).as_equatorial for x in cur_state]
    ras = [x.ra for x in pos]
    decs = [x.dec for x in pos]
    shape = wcs.array_shape
    pix = []
    for x, y in zip(*wcs.world_to_pixel_values(ras, decs)):
        if not np.isfinite(x) or not np.isfinite(y):
            continue
        pix.append([x, y])
    plt.xlim(0, shape[0])
    plt.ylim(0, shape[1])
    plt.plot(*np.transpose(pix), **kwargs)


# Plot the final results
plt.figure(dpi=200)
frame = kete.ztf.fetch_frame(vis.fov)
wcs = kete.irsa.plot_fits_image(frame, percentiles=None)
plt.title("Comet NEOWISE - C/2020 F3\n")

# plot syndynes
for beta in [0.002, 0.004, 0.01, 0.04, 0.2]:
    try:
        plot_syndyne(
            wcs,
            vis[0],
            fov,
            beta,
            day_step=0.1,
            lw=0.6,
            c=(1, 0.0, 0.3),
            label=f"{beta:0.2g}",
        )
    except Exception as err:
        print(f"failure in B={beta:f} syndyne plotting, {err}")
try:
    plot_syndyne(
        wcs,
        vis[0],
        fov,
        1,
        back_days=10,
        day_step=0.1,
        lw=0.6,
        c=(1, 0.0, 0.3),
        label=f"{1:0.2g}",
    )
except Exception as err:
    print(f"failure in B=1 syndyne, {err}")


# plot synchrones
for days in [-10, -15, -20, -25]:
    try:
        plot_synchrone(
            wcs, vis[0], fov, days, 0.1, ls="--", c=(0, 0.5, 1), lw=0.6, label=str(days)
        )
    except Exception as err:
        print(f"failure in {days:d} synchrone plotting {err}")
try:
    plot_synchrone(wcs, vis[0], fov, -5, 0.8, ls="--", c=(0, 0.5, 1), lw=0.6, label=-5)
except Exception as err:
    print(f"failure in -5 synchrone, {err}")

try:
    plot_synchrone(
        wcs,
        vis[0],
        fov,
        0.01,
        1200000.0,
        ls="--",
        beta_steps=2000,
        c=(0, 0.5, 1),
        lw=0.6,
        label=0,
    )
except Exception as err:
    print(f"Failure in 0 day synchrone {err}")

# Fancy plotting of labels around the edge
shape = wcs.array_shape
xvals = []
for line in plt.gca().get_lines():
    idx = np.argmax(
        (line._y > 0)
        & (line._y < wcs.array_shape[1])
        & (line._x > 0)
        & (line._x < wcs.array_shape[0])
    )
    edge = np.argmin(
        [
            abs(line._x[idx]),
            abs(line._x[idx] - shape[0]),
            abs(line._y[idx]),
            abs(line._y[idx] - shape[1]),
        ]
    )
    offset = 30
    if edge == 0:
        label_pos = [0 - offset, line._y[idx]]
        ha = "right"
        va = "center"
    elif edge == 1:
        label_pos = [shape[0] + offset, line._y[idx]]
        ha = "left"
        va = "center"
    elif edge == 2:
        label_pos = [line._x[idx], 0 - offset]
        ha = "center"
        va = "bottom"
    elif edge == 3:
        label_pos = [line._x[idx], shape[0] + offset]
        ha = "center"
        va = "top"
    plt.text(
        *label_pos, line.get_label(), va=va, ha=ha, fontsize=6, color=line.get_color()
    )

# add vectors
try:
    plot_vectors(frame_wcs, vis[0], vis.fov, y=0.85)
except Exception as err:
    print(f"Failure in vector plot, {err}")
# for some reason astropy for this frame is plotting the y-axis inverted
# this just un-inverts it.
plt.gca().invert_yaxis()
plt.show()
Total running time of the script: (0 minutes 4.025 seconds)